Visualization of the halving’s supply shock
| If you find WORDS helpful, Bitcoin donations are unnecessary but appreciated. Our goal is to spread and preserve Bitcoin writings for future generations. Read more. | Make a Donation |
Visualization of the halving’s supply shock
By Croesus
Posted October 23, 2020
Bitcoin halvings cause a supply shock. The slow accumulation of this supply shortage drives a bull market in the ensuing ~18 months.
2012 and 2016 halving -> 2013 and 2017 mania. 2020 halving on track for same.
This thread attempts to visualize those mechanics.
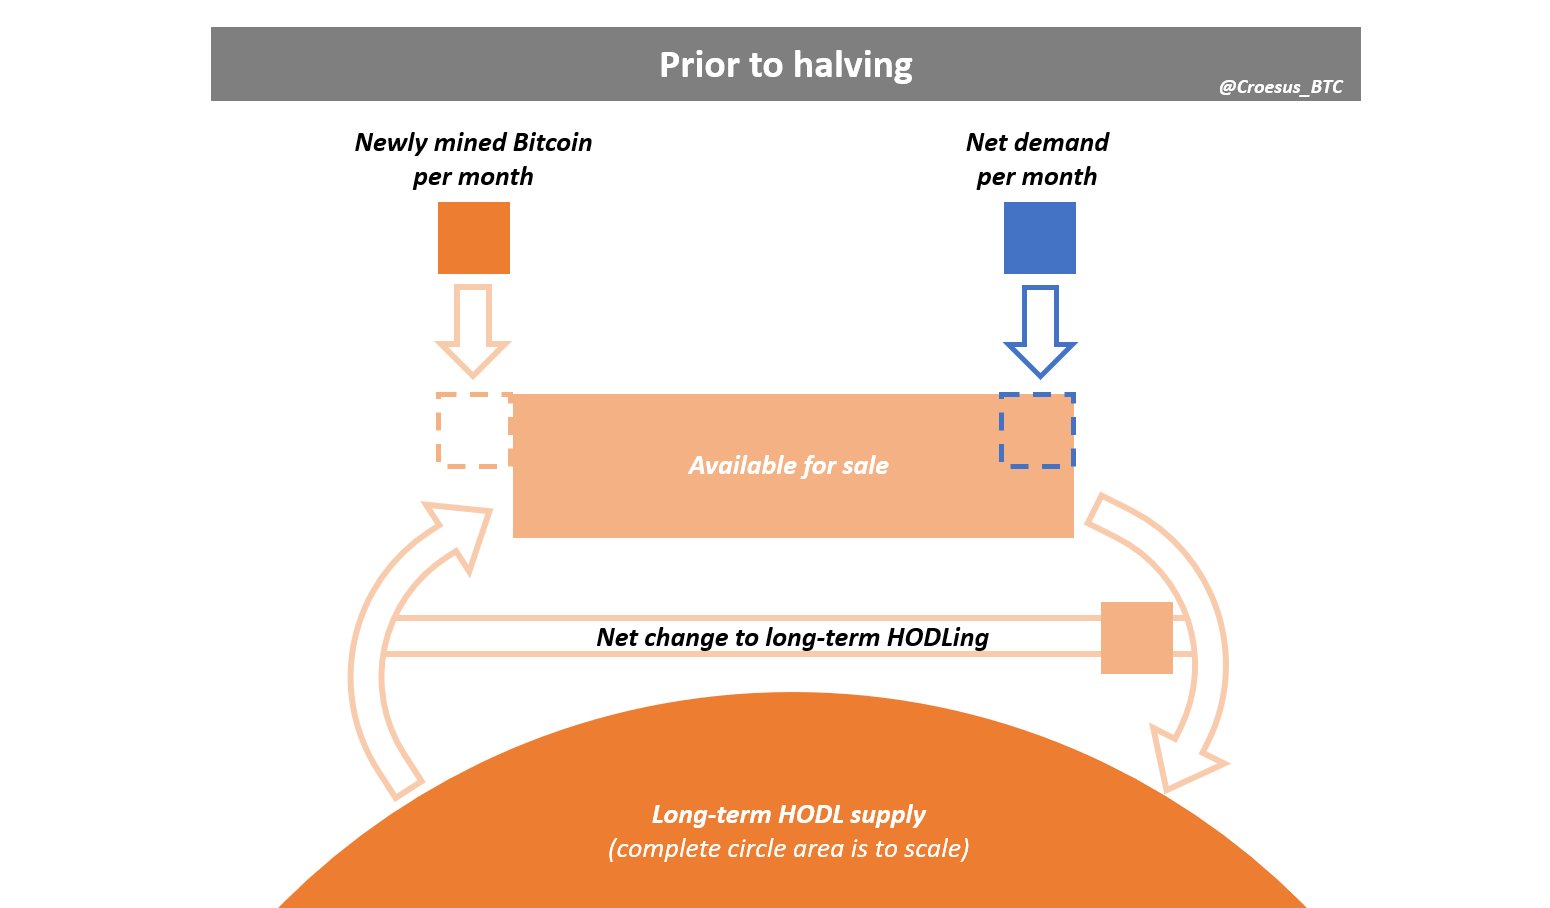
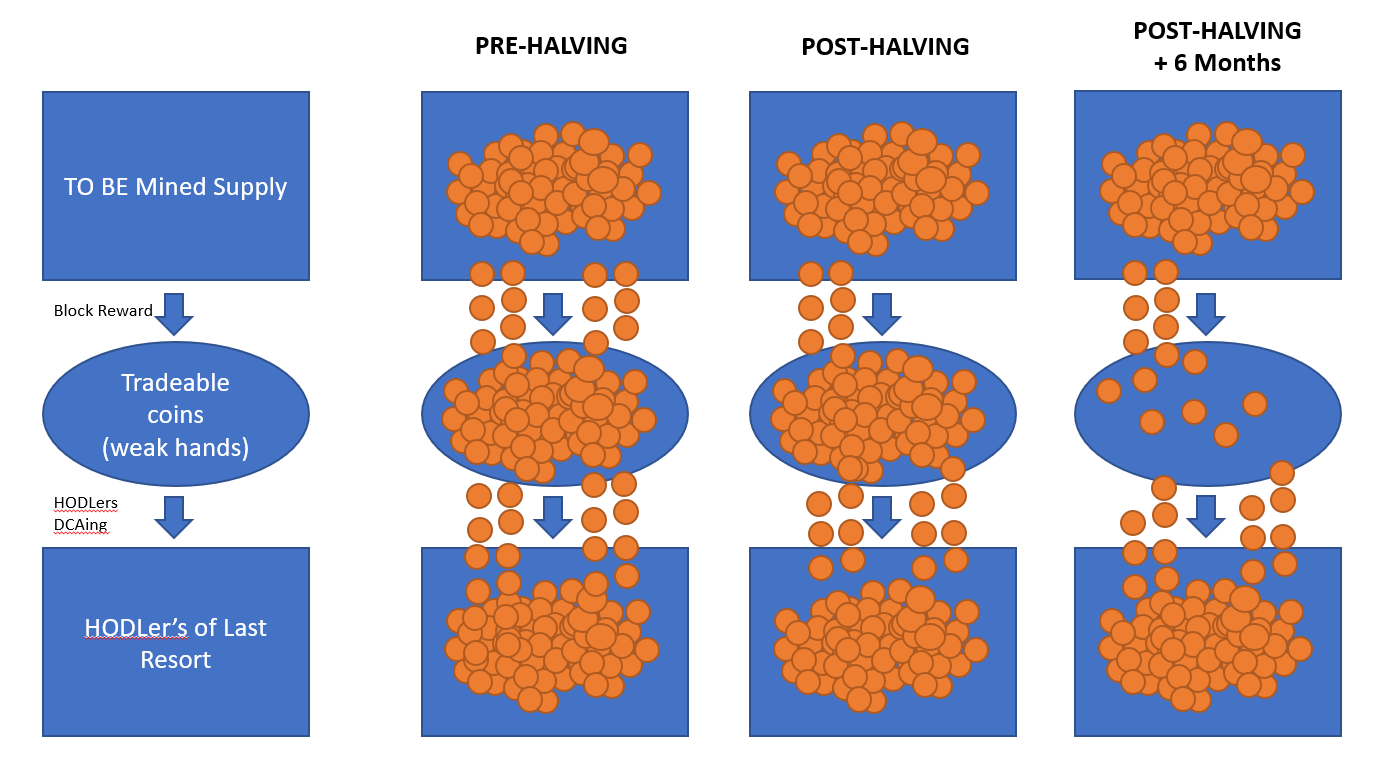
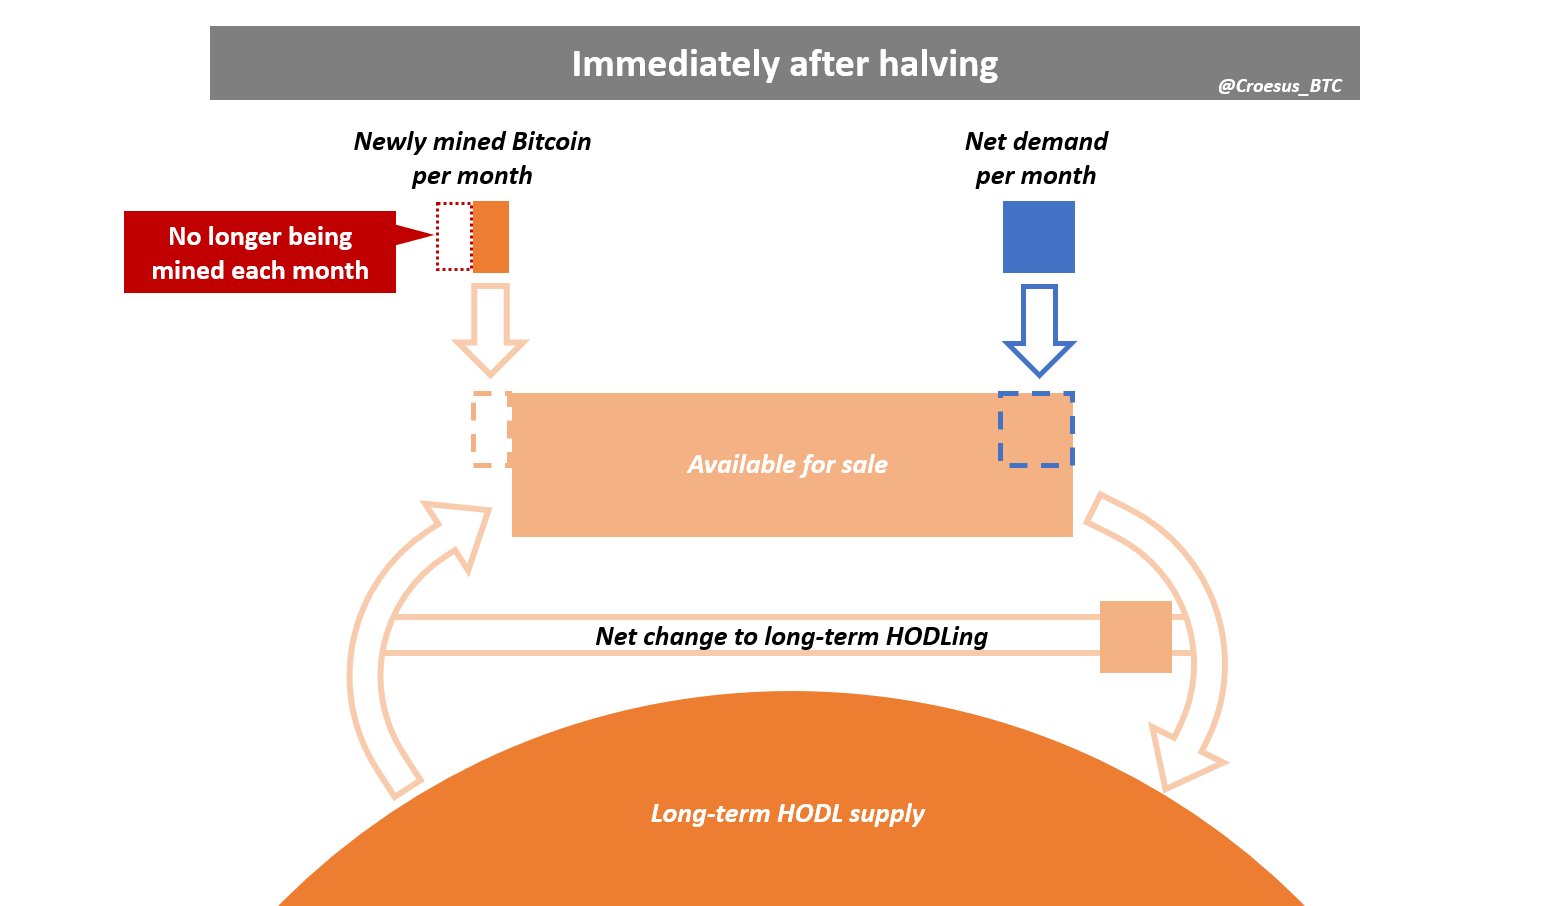
The halving causes new supply to be cut in half, but net demand remains the same. From this point on, a supply shortage accumulates.
Note: areas shown to scale for May 2020 halving. Assumed “available for sale” supply = UTXOs moved in prior month, aka 5% of circulating supply.
Supply shortage slowly accumulates. Net demand is moving twice as much supply into long-term HODLing as mining is creating each month.
Supply “available for sale” on exchanges shrinking, but accumulated impact still small.
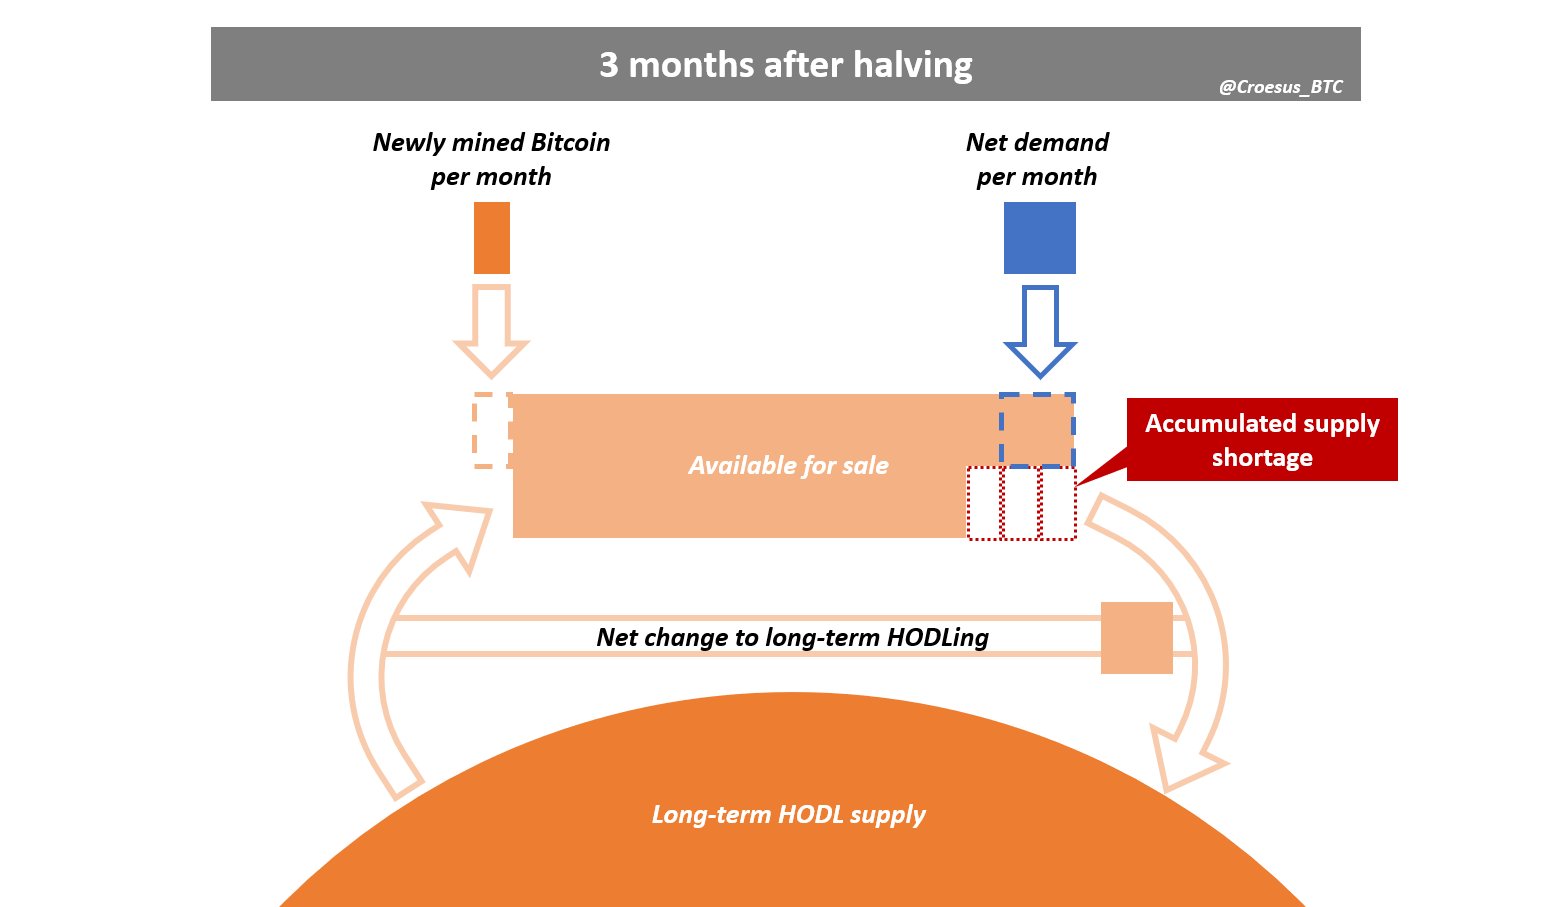
Accumulated supply shortage now significant. As market participants bid for significantly reduced “available for sale” supply, price drifts upwards.
In a typical market, this induces new supply production to increase and selling from existing holders to increase.
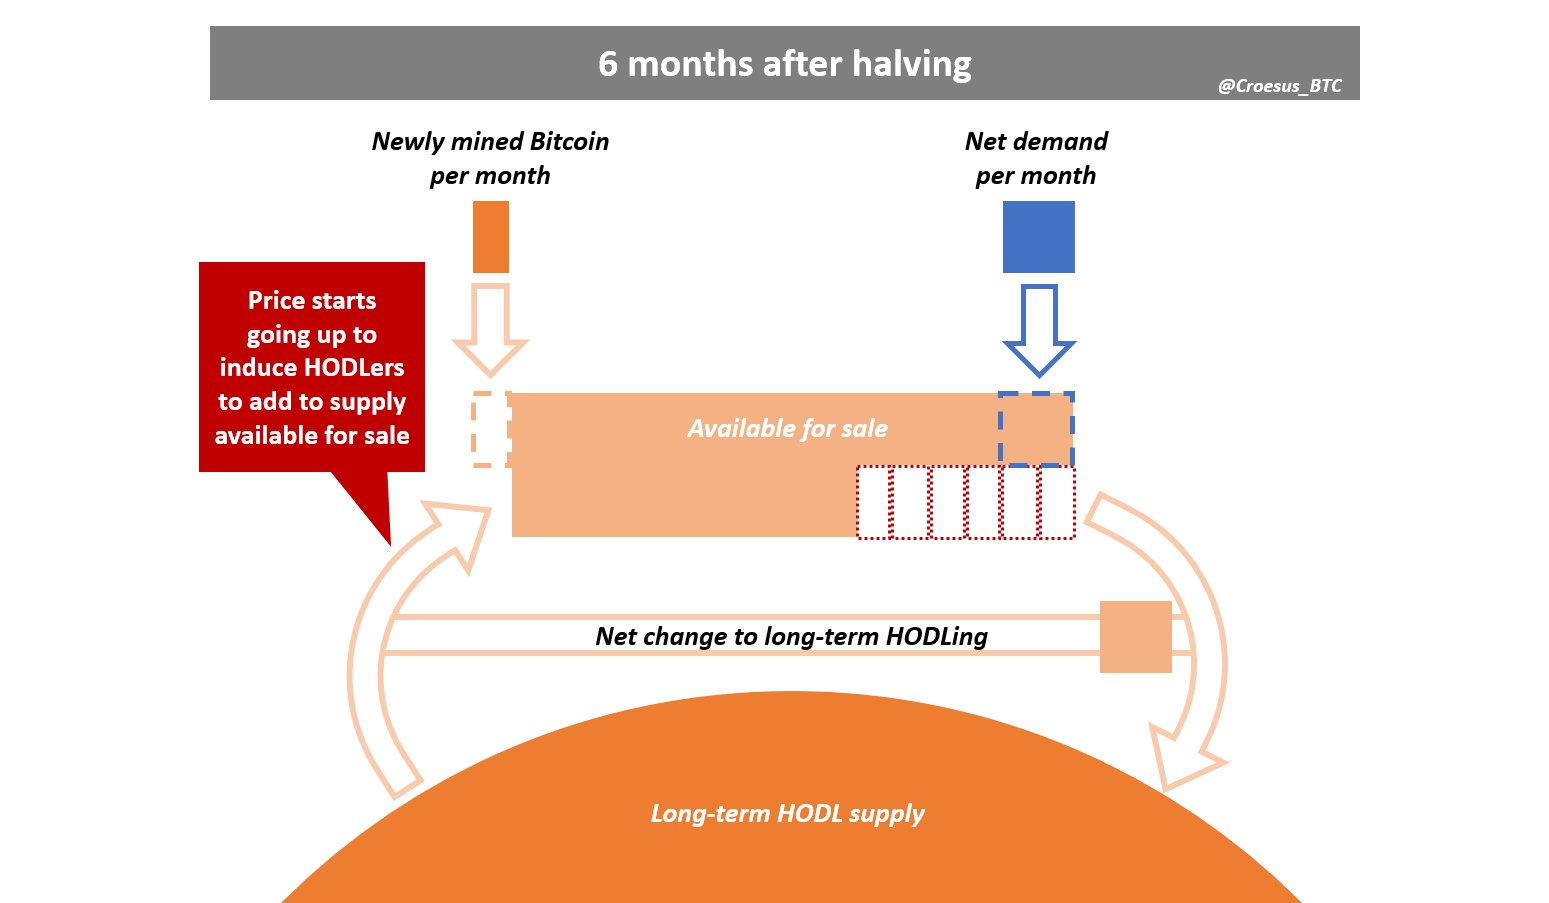
Miners cannot increase production, but HODLers do start to add supply to “available for sale”.
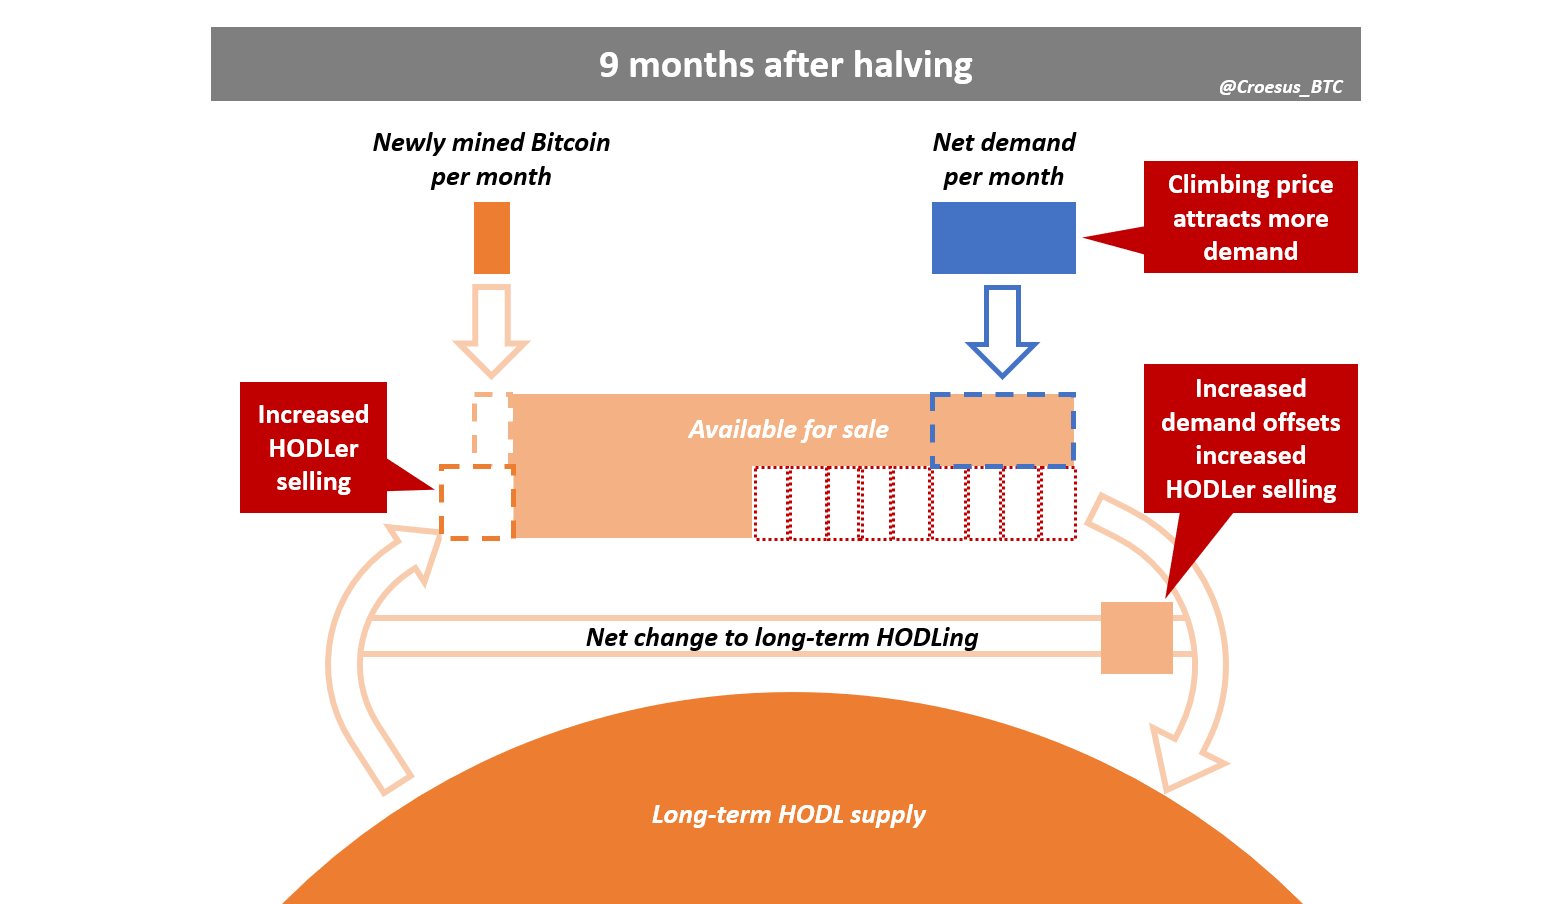
However, because of Bitcoin’s characteristics as a startup SoV asset that 99%+ of people don’t have significant positions in yet… price going up also attracts interest & more demand.
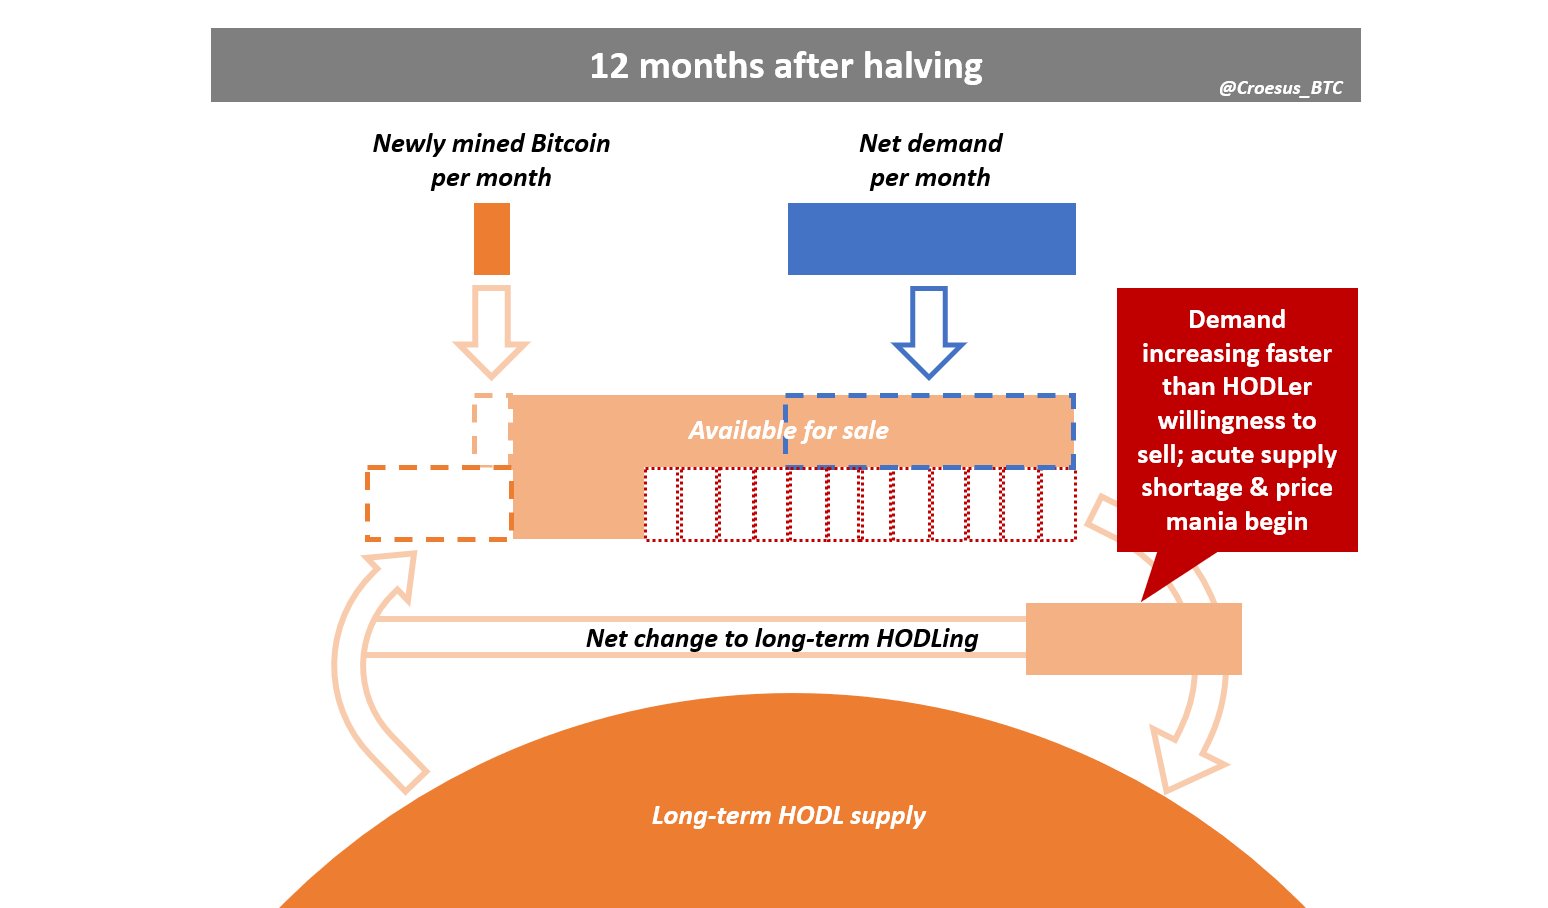
As enthusiasm builds, new demand increases faster than HODLer willingness to sell. This causes a sharp increase in the rate of supply shortage accumulation, accelerating price growth.
This begins the mania phase, which ends when HODLer willingness to sell flips net demand.
Granted, there is a great deal of noise obscuring these mechanics, so it’s certainly not as clean as I’ve portrayed here. However, I believe this is the signal underneath the noise - the mechanics at the heart of how halvings drive 18-month parabolic bull markets.
Shoutout to @Moon__Capital for inspiring these diagrams with this excellent tweet:
How does a Bitcoin Halving drive UP price? It’s simple. Coins get allocated to strong hands that understand bitcoin FASTER than new coins are mined. Eventually there are no more bitcoin for sale at $10k, only $500k.