
The Puell Multiple
| If you find WORDS helpful, Bitcoin donations are unnecessary but appreciated. Our goal is to spread and preserve Bitcoin writings for future generations. Read more. | Make a Donation |
The Puell Multiple
A New Barometer of Bitcoin’s Market Cycles
By cryptopoiesis
Posted April 4, 2019
Most metrics aimed at timing or quantifying Bitcoin’s market cycles, from a fundamental perspective, have by and large focused on the velocity of value settled on chain, or lack there of, thus analysing the cycles from a buyer/investor’s perspective. Realised Cap, NVT Ratio, Market-Value-to- Realised-Cap (MVRV) and HODL Waves are just a few powerful metrics and visuals that have provided valuable insight.
 Being David Puell
Another type of metric, which has recently gained some attention in the Crypto community, is the the Dollar Value of Mined Coins on daily basis or Bitcoin’s Daily Issuance. This metric proved to have consistently identify all the swing lows based on previous All Time Highs like clockwork. This relationship held for the two major, halving associated, bull-bear market cycles as well as the several shorter ones during the early years.
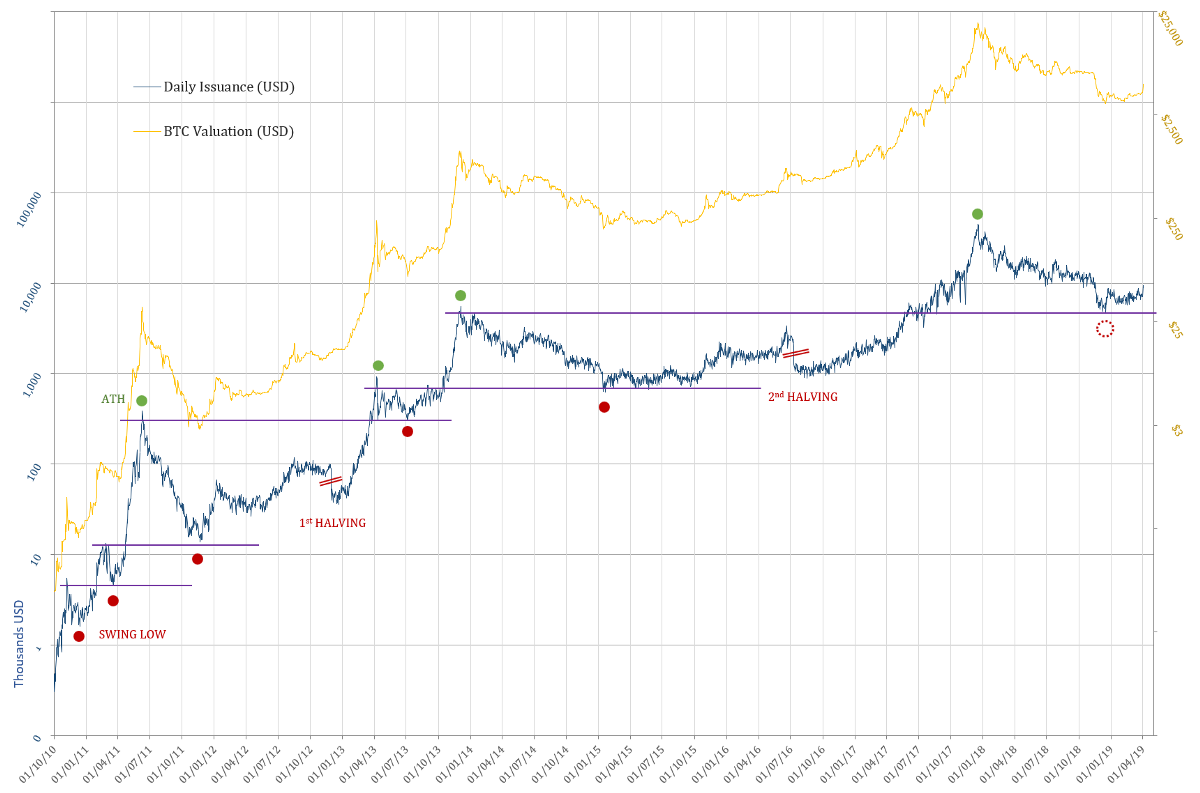
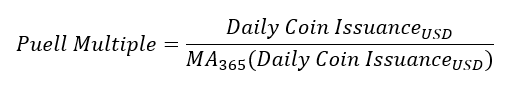
This metric shines a light onto the other side of the coin from the proverbial Hodlers of Last Resort, namely the Compulsory Sellers and the fundamentals of mining profitability that are at play in shaping Bitcoin’s market cycles. David Puell’s simple yet ingenious idea of adjusting this metric by its yearly simple moving average has produce a new, powerful and elegant tool to gauge the market cycles from a Mining Profitability/ Compulsory Sellers’ perspective.
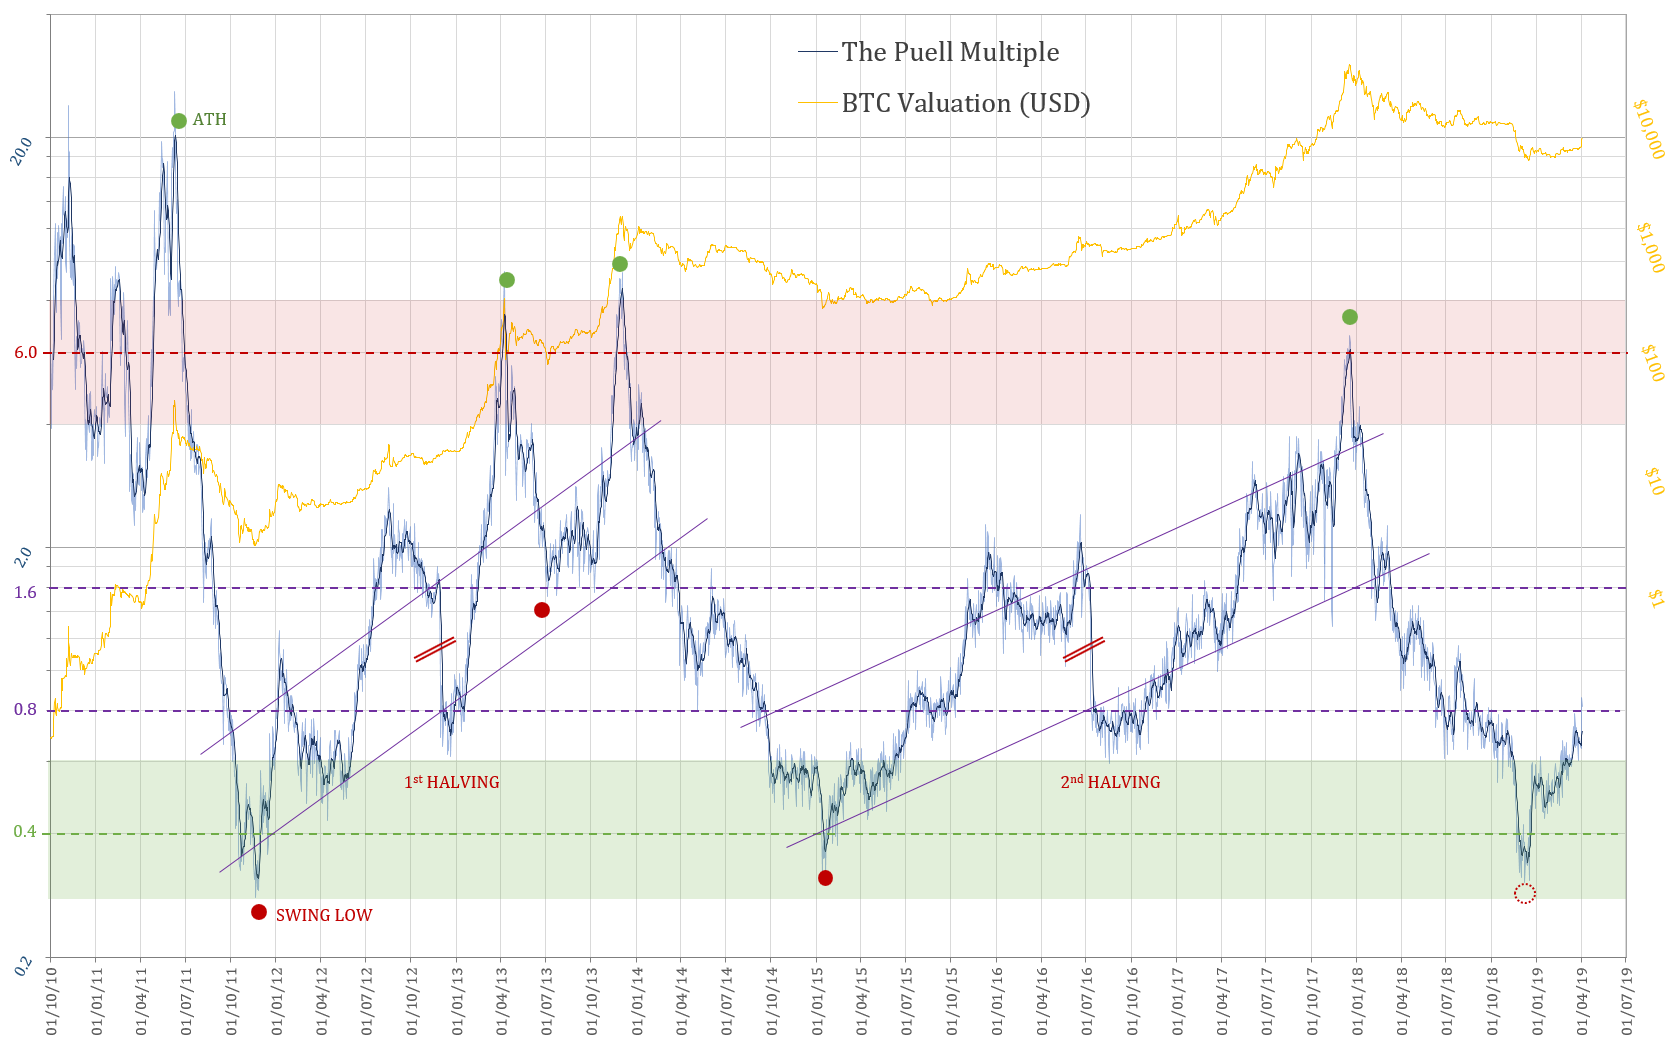 The Puell Multiple
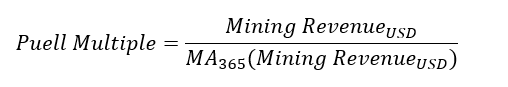
As the mechanism which underpin the correlations are dictated by the dynamics of Mining Profitability, the daily bitcoin issuance coming from block rewards has so far sufficed — daily coin issuance having currently a theoretical average of 1,800 bitcoin daily. However, after the next (third) halving which is due in mid 2020, the transaction fees collected by miners will no longer be trivial by comparison to block rewards. The relationship of this metric therefor, would most likely have to include the entire Daily Mining Revenue, which incorporates the transaction fees in addition to the block-reward e.g.:
Previous attempts at quantifying the fundamentals from the miner’s perspective, used as a starting point the PetaHashDollar metric (Daily Mining Revenue divided by Daily PetaHashes). The attempts at normalising, either by a trend, or more organically by using the Difficulty Adjustment, have all fallen short of producing a simple and accurate metric. Furthermore, all the different averages which have been tried out so far to calculate the Puell Multiple, have proven to skew the metric in one way or another. They failed at achieving a virtually perfect alignment of the tops, bottoms and, interestingly enough, the levels at which both previous halvings took place.
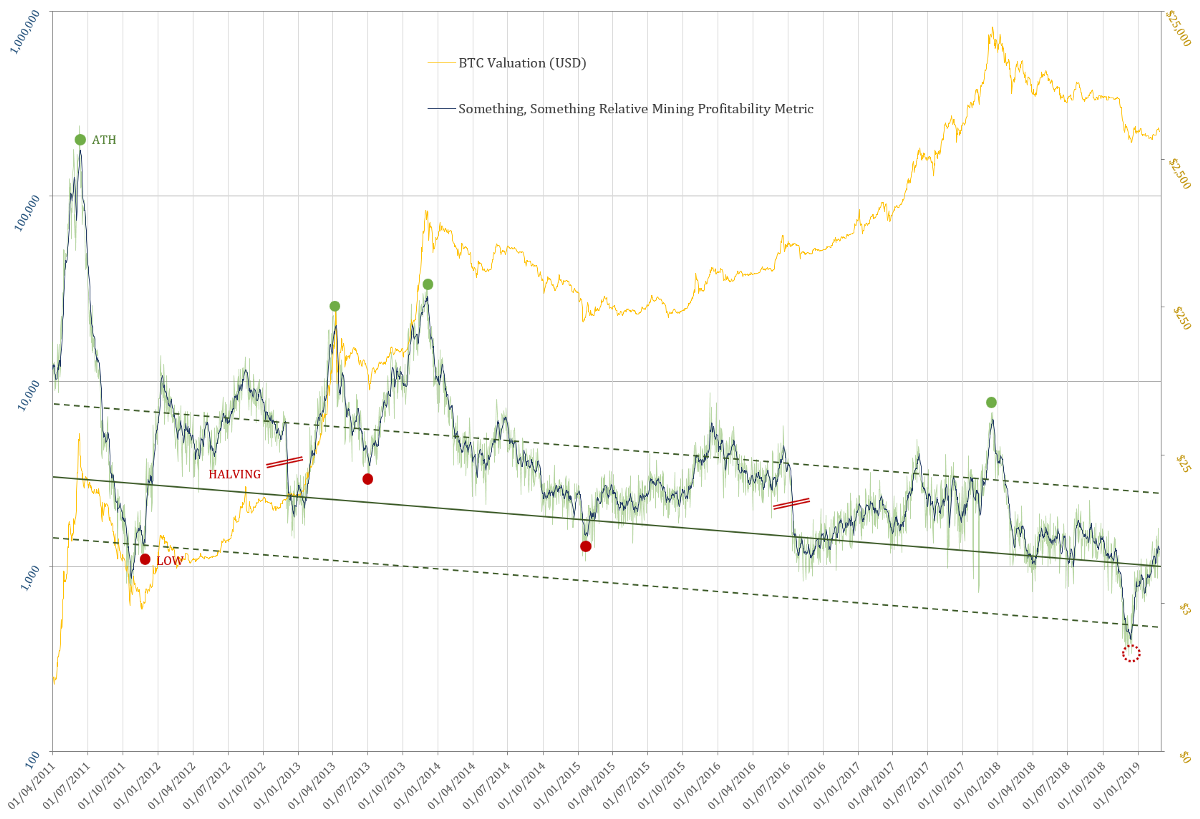 Example of a work in progress Mining Profitability Metric that took into account and adjusted for: Hash Rate, Mining Revenue and Difficulty Adjustment
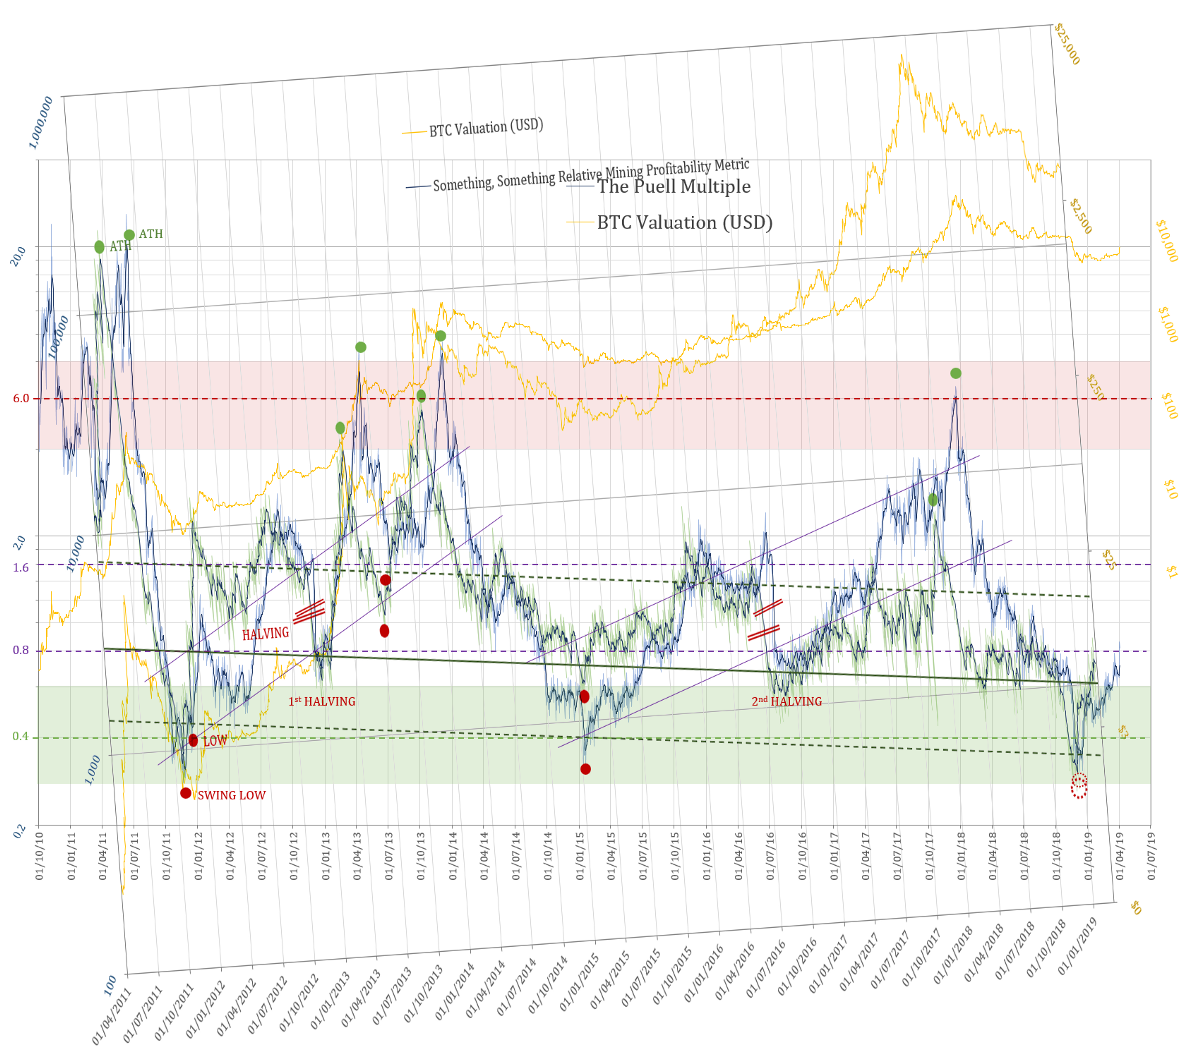 The same Mining Profitability Metric superimposed onto the Puell Multiple
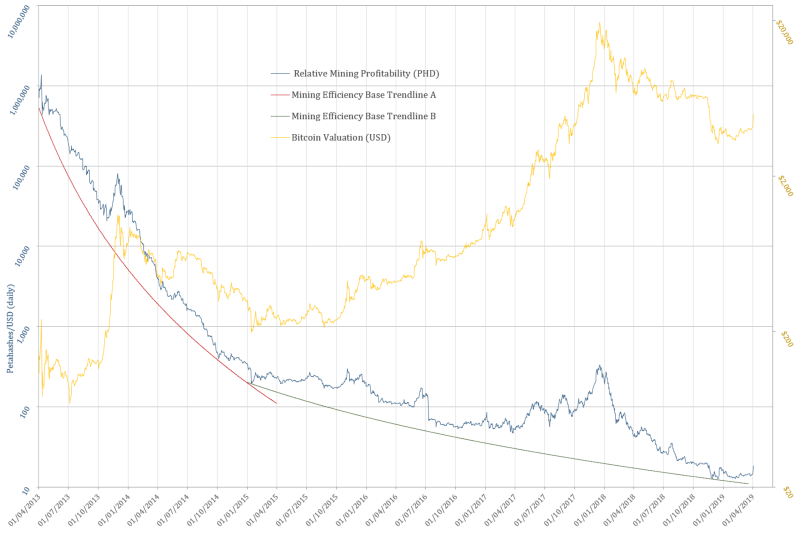 Another example: PetaHashDollar = Mining Revenue / Hash Rate
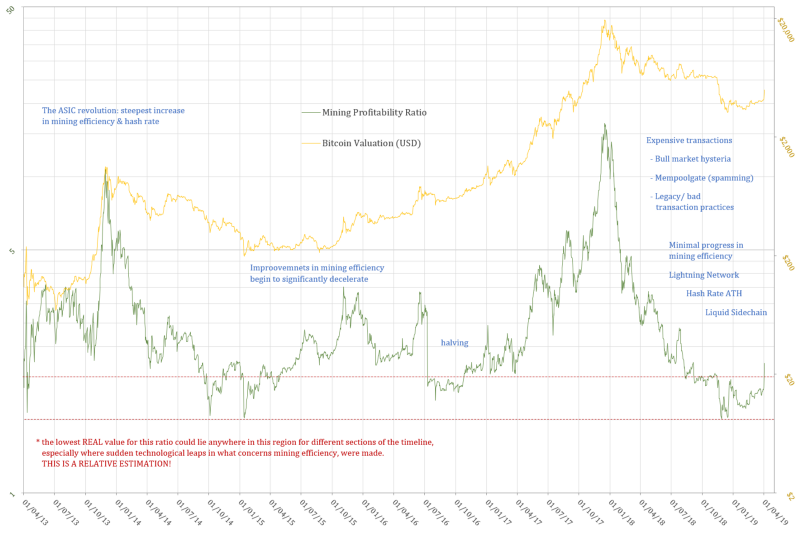 Mining Profitability Ratio derived from PetaHashDollar normalised by the baseline equations
Where To?
If one is to expect the next halving to occur at levels of the Puell Multiple in line with the two previous ones (1.6), it would be an interesting exercise to use it in approximating the price of Bitcoin around the next halving. As no data that would go into making the Daily Coin Issuance 365 days SMA is in at this time, only an eyeballing approach can be employed for this purpose. This would allow comparing this hypothetical range to the one which can be calculated by the forward projection of the non-linear regression of the price.
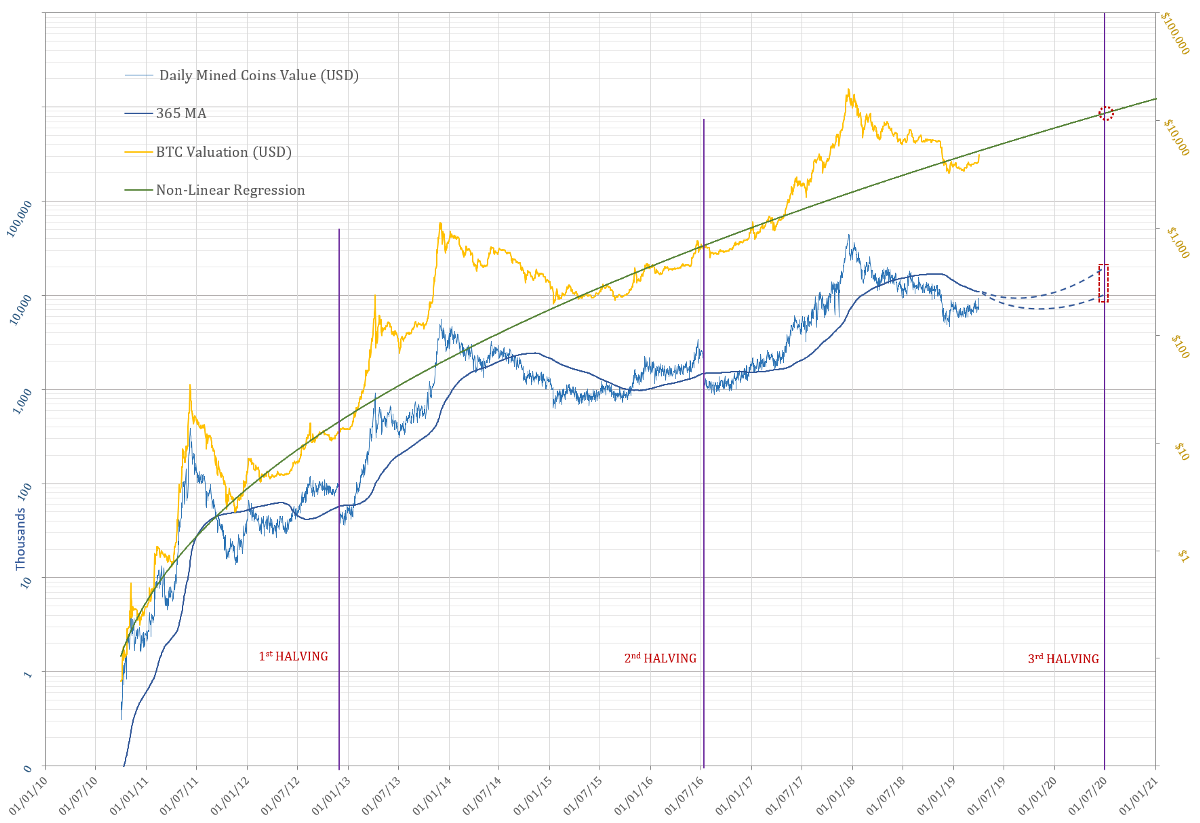
A variation on Renato Shirakashi’s Non-Linear Regression Curve for Bitcoinhas been developed with new parameters as to minimise the total of daily percentage divergence from the original Shirakashi’s Regression, and which can be said to “better hug” the base of the price-line. As the volatility and magnitude of future bull-markets/ bubbles are expected to decrease with the maturity and growth of this financial asset, this version had been chosen for the purpose of this projection.
Eyeballing the 365day SMA of the Puell Multiple between the values shown in the the graph above would imply a price in the range from $8,889 to $17,778,that of course if the halving would occur, once more, at Puell Multiple level of ~ 1.6.
The non-linear regression would be at this point in time at a level of $11,667. The first halving occurred below this regression model, while the second occurred at the level… will this trend continue… and see us above the non-linear regression model at the time of the halvening in mid 2020? Yes, with a large dose of hopeium :)
Acknowledgements
- David Puell
- Renato Shirakashi
- TusenPi All reference data used throughout this article has been sourced from:
- BitcoinVisuals.com (Hash Rate, Coin Supply)
- Blockchain.info (Daily Market Price, Daily Transaction Fees/BTC)
- CoinMarketCap.com (Closing Daily Price)
Postscriptum
Bitcoin is Beautiful!
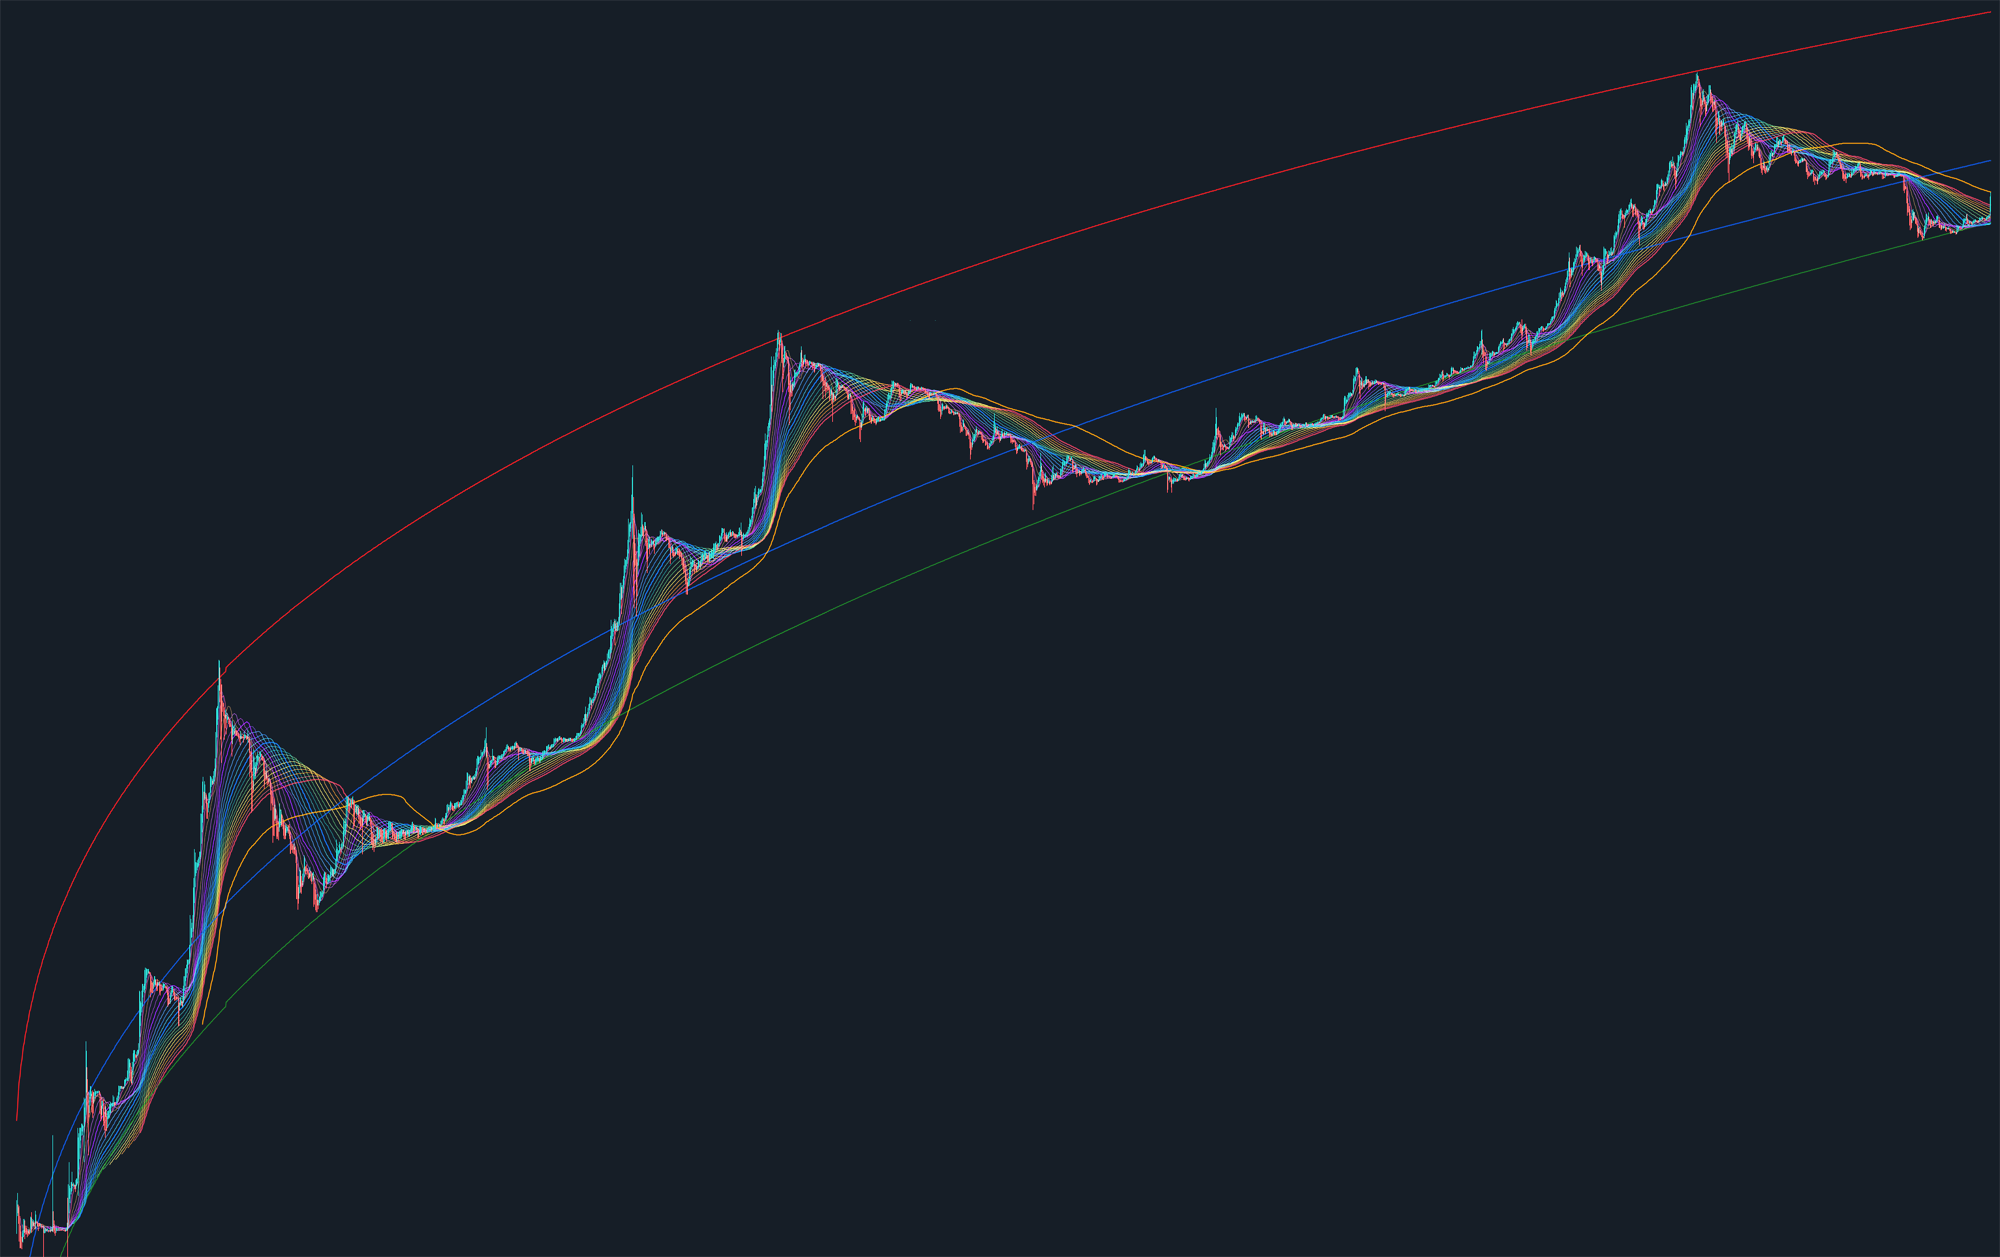 Bitcoin’s Non-Linear Regression Curve by Renato Shirakashi & Multiple SMA by TusenPi