The Patoshi Mining Machine
| If you find WORDS helpful, Bitcoin donations are unnecessary but appreciated. Our goal is to spread and preserve Bitcoin writings for future generations. Read more. | Make a Donation |
The Patoshi Mining Machine
By Sergio Demian Lerner
Posted August 22, 2020
One of the topics that has been debated endlessly is what kind of hardware Satoshi used for mining. Some people argue he only needed a single computer using the latest generation of Intel processors available in 2009, using a CPU miner with SSE2-optimizations and multi-threading. Others argue that he had about 50 low-end networked computers. In this article, I will shed some light into this topic with some new discoveries.
But first, a disclaimer: all we know about how Satoshi mined blocks we know from the Patoshi pattern research and the relation between this pattern and Satoshi through some known public transactions between early Bitcoin devs and Satoshi. Because the relation is based on unsigned emails and not math, we’ll never be sure. In this article, to sidestep that debate, we’ll only talk about Patoshi.
Before we dive into the technical details, the reader has to accept that a single high-end server in 2009 could have mined all Patoshi blocks if running an optimized version of a Bitcoin CPU miner from 2010. We could debate if Patoshi was aware of these optimizations, but from the technical perspective, it’s a solved issue. Some optimizations Patoshi could have easily spotted. For example, an optimized SHA256 hasher existed in cryptopp (an open-source and widely known cryptographic library) a year before Bitcoin was created. It would also need some other optimizations that appeared in the Bitcoin code months later of its launch, such as not recomputing the mid-state, and mining in multiple simultaneous threads. But both of them are pretty obvious. Mining multiple 4 nonces simultaneously with SSE2 instructions (also known as 4-way data-level parallelism or SIMD), would be not so easy to code, yet the idea is very old. The latest CPU miners used circa 2012 could scan 8 nonces simultaneously (8-way) with AVX instruction extension. But the AVX opcodes did not exist in 2009, but only SSE2 extensions existed in the latest Intel processors. If you take the Bitcoin source code from late 2010, all the optimizations combined represent a speedup of 10X compared to the public reference miner in Bitcoin v0.1 (approximately 1.5X from starting with mid-state, 4X from multi-threading, and 1.6X from SSE2). In 2010 it’s well documented that a single computer from 2009 could mine all blocks at difficulty 1 to keep the network stable, using only 60% of the CPU.
Here I show the performances of a multi-threaded CPU-miner (4 threads), using SSE2 2-way, 4-way, and AVX 8-way instruction sets. All measurements were performed on the same machine (my intel core i5-4460S @ 2.90GHz).
| CPU (not SSE2) | 4-WAY SSE2 | 8-WAY AVX | |
| Avg. time per block [sec] | 619 | 219 | 118 |
CPU Mining with multi-threading and different levels of optimizations
My computer, the Intel core i5-4460S, has a performance that is approximately the same as the Intel Core i7-965 Extreme chip, which was state-of-the-art in 2009. I did my own performance measurements to be sure that the Intel core i7 micro in 2009 could have mined steadily all blocks at difficulty 1. It could even have mined all blocks at difficulty 2.
Strangely, an implementation of SHA512 using SSE2 optimizations was present in the Bitcoin 0.1 codebase itself, but not one for SHA256. The SHA512 does not implement 4-WAY scan because SHA512 is not used for mining.
From Speculation to Evidence
Patoshi’s pattern research revealed that Patoshi only scanned a subset of the nonces. We can describe this restriction as a reduction of a single sequential scan interval, the parallelization of 5 sequential intervals, or as the combination of a “selector byte” and a smaller 24-bit sequential scan space (the selector is positioned in the LSB of the nonce). The first two interpretations fit better with the idea of a single computer scanning the nonce space with one or multiple threads. The second interpretation, first proposed by user Eyal0, has given birth to other more sophisticated hypotheses, such as that Patoshi had many networked computers connected in a kind of mining pool. The explanation of the selector byte is also compatible with Patoshi using a rare single parallel computer, such as a TILE64 board, where each processor scans a reduced range. It’s also compatible with using a GPU. To summarize, he could have used any of these machines, and speculation without evidence will lead us nowhere. That’s why a month ago I decided to explore the blockchain to find a definitive answer.
I started by analyzing nonce histograms of the first 18K blocks mined. I chose to analyze only the first 18K blocks because it’s known that Patoshi used a fixed nonce distribution on those blocks. Afterward, Patoshi starts reducing his hashrate by removing parts of the nonce range scanned, and that would ruin the histograms. The following histograms show the nonce distribution of the 2^32 possible nonce values over 128 buckets for all non-Patoshi blocks in the first 18K blocks, and in the first 50K blocks.

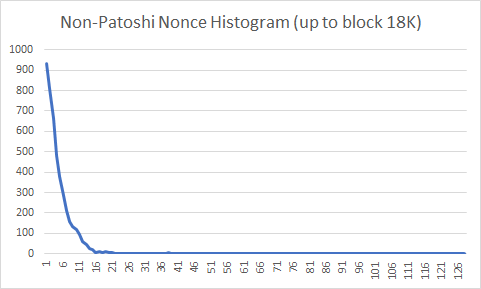
You can see that the probability decays exponentially. The mining difficulty during this period was 1, which means that the whole network finds a block solution after testing 2^32 nonces on average. Why is it that most non-Patoshi miners, which mine much slower than Patoshi, find blocks so “quickly” that it seems that they are scanning 10% of the space? The explanation is simple: all individual miners, on average, find solutions after the same number of nonce tries. However, the histogram of non-Patoshi block nonces combines the output of several individual miners, and therefore the probability that any of them finds a block before reaching the average number of nonces is much greater than each one individually. Keep in mind that the nonce is reset for every new block. As an example, the average number of times you need to throw a dice to obtain the number one is 6, and if after getting a one you restart (a following “round”), then the average number of tries is still 6. But if you throw 3 dices simultaneously, then on average you will be throwing each dice only 2.37 times per round until you find the number “one”.
The following two histograms show the real nonce distribution over in the first 10% of the nonce space, and the distribution obtained by a discrete-event simulation where each individual mining machine has only 4% of the network hashrate.
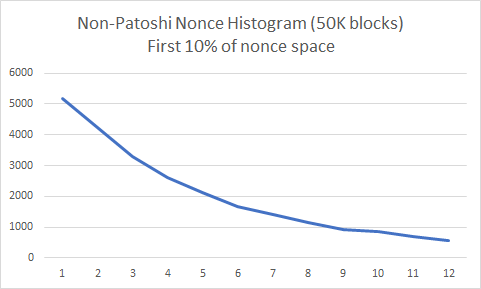
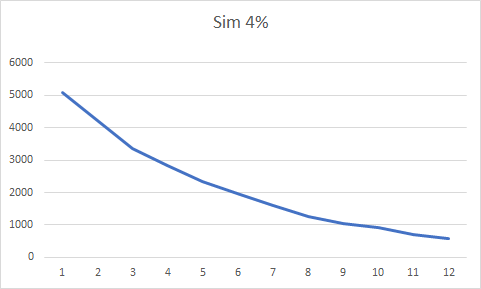
You can see that both distributions look alike. Can we do the same with Patoshi blocks? We know that Patoshi used one byte of the nonce in a strange way, either mining over a restricted range or mining in parallel over many ranges. Therefore we could ask how the nonce should be distributed if Patoshi scanned the space sequentially or used a selector byte and scanned the remaining 24 bits, as an unsigned integer. Will any of these histograms show a clear decay in probability?
The Mysterious 19
In a recent article, user TechMix discusses the strange behavior of the value 19 in the Patoshi nonce range. Today we’ll reveal this mystery. TechMix, along with user OrganOfCorti identified several subranges in the Patoshi range. These subranges are mined with the same hashrate. The subranges are: [0..9],[19..28],[29..38],[39..48],_and _[49..58]. Between 9 and 19 there is a nonce gap. We’ll call each individual range of size 2^24 associated with a certain LSB byte a unit range, and therefore each subrange contains 10 unit ranges. The Patoshi subrange boundaries with the nonces outside the Patoshi range (9, 19 and 58) look diffuse in the histogram: the probability of mining on these unit ranges is lower than the rest of the subrange. TechMix was perplexed about the reason. Finding the answer requires abandoning the idea that the pattern comprises a selector byte and a unit range. Here I present the histograms of the nonce unit ranges 9, 19, and 58:
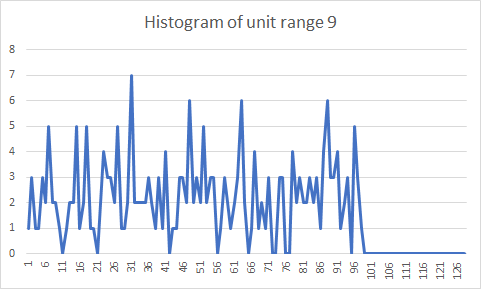
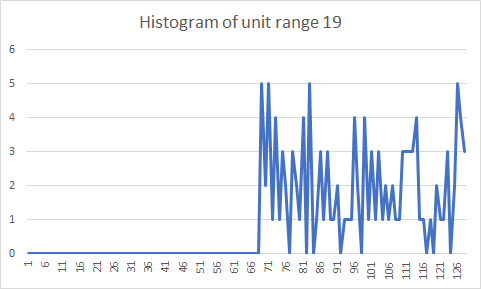
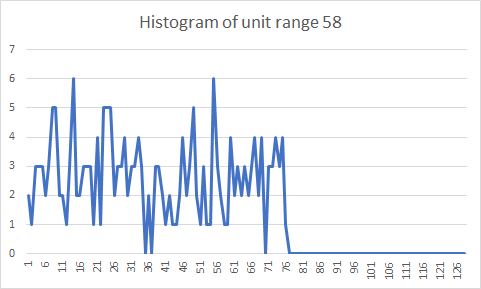
We see clearly that the reduction in probability is just that Patoshi didn’t establish his ranges in terms of unit ranges. The exact positions of the subrange bounds are 163840000, 327680000, and 983040000. The size of the last contiguous range is 655360000. Of course, these are beautiful round numbers obtained by the formula N * 0x4000 * 10^4. To simplify our explanations, we can define a punit to be 0x4000 * 10^4. The punit range is slightly larger than the unit range. Each Patoshi subranges is composed of 10 punit ranges. For simplicity, we’ll still name the subranges [0..9], [19..28] and so on, even if that naming convention is inexact.
Scanning by incrementing the Inner or Outer Nonces
To fully understand how Bitcoin mining evolved we need to dig deeper into how SHA256 works and how Bitcoin v0.1, the first public release, was coded. The Satoshi client v0.1 was compiled first for Windows machines, and almost surely for an Intel x86 chip. The x86 architecture is little-endian. SHA256 is defined without a reference to a specific endianness, but making use of uint32 types. SHA256 can be implemented in C language without messing with machine endianness: constants are expressed as uint32 numbers, additions and even bit-shifting operations can be performed on full uint32 types, without ever casting a uint32 pointer to an unsigned char pointer. However, the input of SHA256, the Bitcoin header, is not a list of uint32 values, but an array of bytes. Therefore the SHA256 standard must specify how a list of bytes is converted into a list of uint32s, and how the last internal state of SHA256, which is a list of uint32 values, is converted back to a list of bytes. The SHA256 standard states that the input bytes are considered as if they were read unaltered by a big-endian machine, so the first byte of the Bitcoin header will be the highest significant byte of the first uint32. In a little-endian machine, the first byte is not the MSB of an uint32, so the first 4 bytes must be reversed prior to being processed by SHA256. The same happens for all groups of 4 bytes (20 uint32 in total). Because all fields in the Bitcoin header have sizes that are multiple of 4, one of these groups maps directly to the nonce field. The following diagram shows how the different fields are mapped into uint32s.
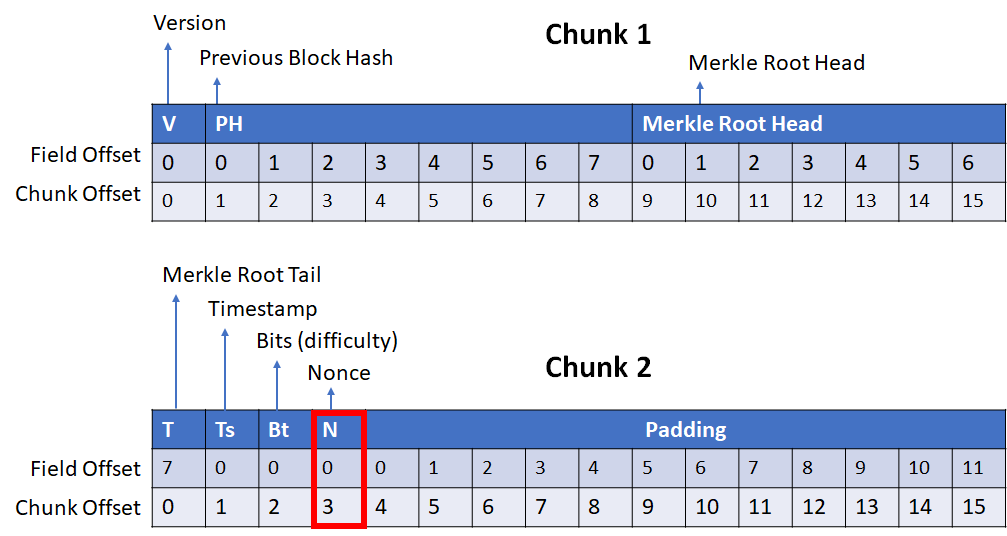
The bitcoin header comprises two 64-byte chunks, split into 16 uint32s. The diagrams names these uint32s from 0 to 15. The Bitcoin client v0.1 incremented the nonce field as little-endian prior hashing, which means that just before hashing, the nonce (and all remaining uint32s) were reversed in memory. The following code in the Bitcoin client shows how it was performed:
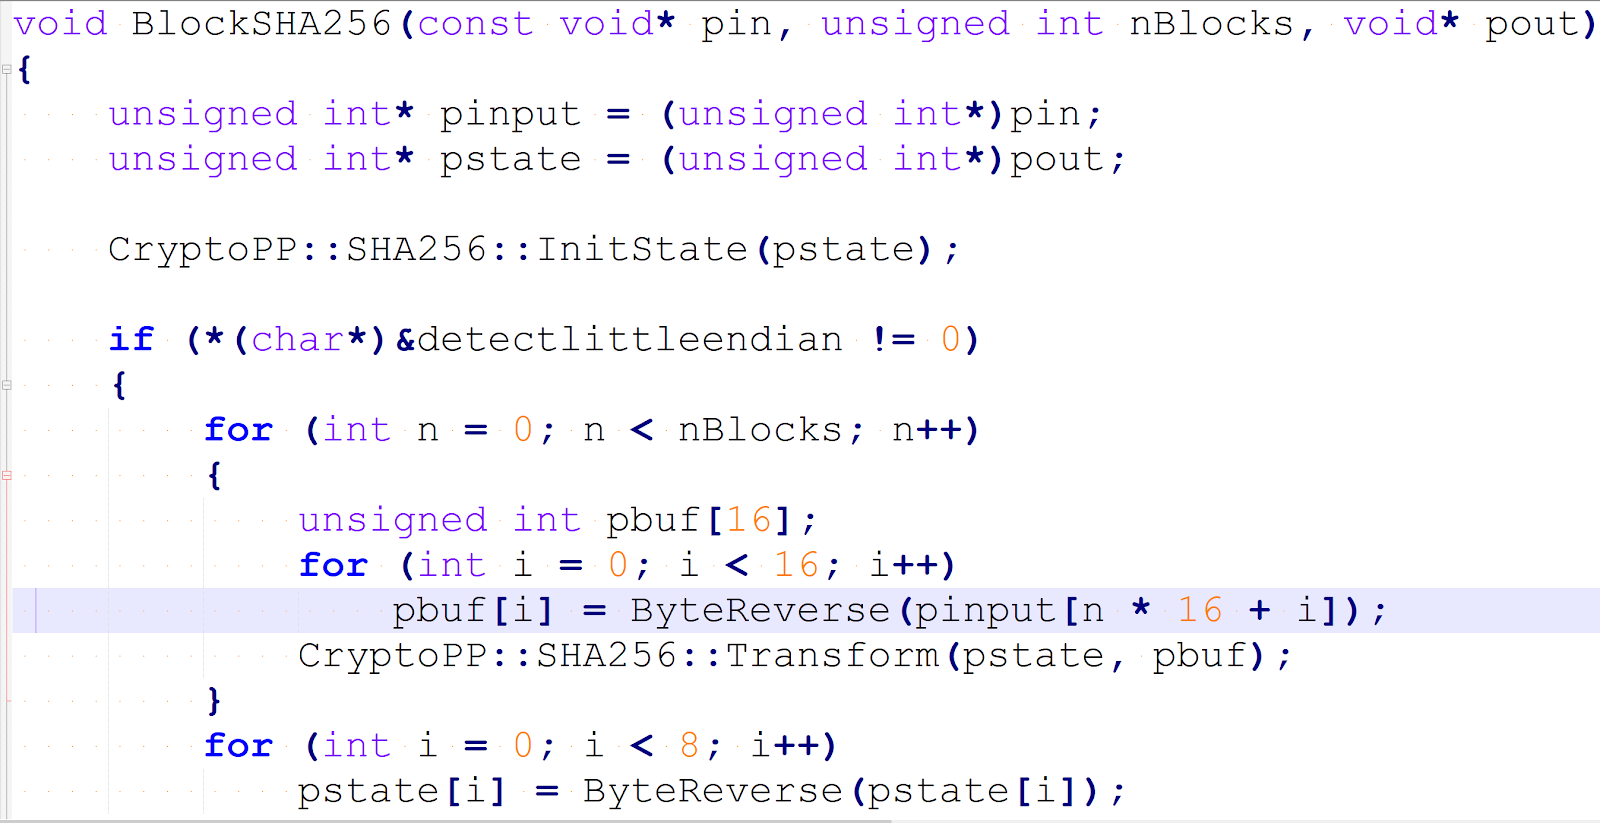
Code that reverses each uint32 of the Bitcoin block header
Since mining consists mostly of incrementing the nonce and hashing twice repeatedly, it’s clear that the continuous reversal of the nonce and the rest of the fields in the header is unnecessary, because almost all fields except the nonce do not change often. Regarding the nonce, Bitcoin is indifferent to the internal format of the nonce: you can increment it or decrement it, or even rotate it over all possible values using an 32-bit gray code. Therefore the miner can increment the nonce in little-endian or big-endian format and still cover the whole nonce space after 2^32 steps.
We’ll say that the miner is mining with an outer positive (OP) algorithm, if it increments the nonce before reversal. We say the miner algorithm is inner negative (IN), if it decrements the nonce after reversal of the header fields. The other options are also possible (outer negative (ON) and inner positive (IP)). The first version of Bitcoin was outer positive, in version 0.3.22 (2010) the node adopted an inner positive algorithm to optimize mining.
Since Patoshi was mining with a special software different from the public version, we can hypothesize that he scanned the inner nonce. Under this assumption, we obtain the following histogram. The nonce is reversed and the outer nonce LSB now becomes the MSB of a 32 bit unsigned integer. Because we’ve analyzed the outer nonce LSB before, we already know how the inner nonce histogram would look like:
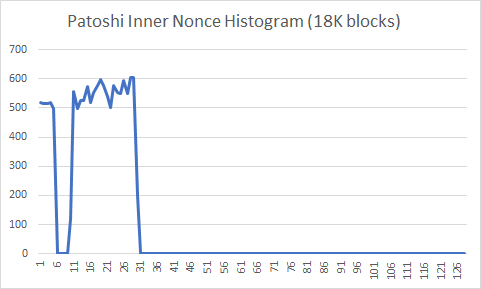
The histogram shows a slightly increased probability for higher nonces within the Patoshi range. There are two main continuous ranges, [0..9] and [19..58], but we’ll assume that the second continuous range contains 4 subranges, as defined before. We’ll assume that each of the five resulting subranges was scanned in parallel by Patoshi. To test this hypothesis, we show here the nonce histogram of the range [19..58] expanded. Each bucket is only about 2^22 nonces:
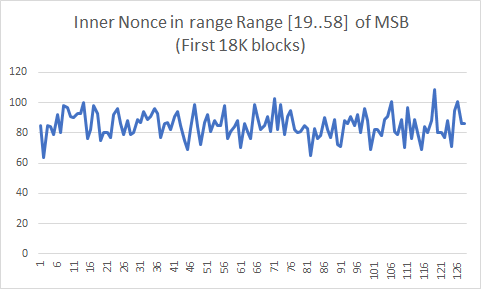
The Patoshi inner nonce histogram looked like there was a higher probability for higher nonces, but in this histogram of the range [19..58] I can’t see a clear bias. This is compatible with our hypothesis of a parallel search. To test the hypothesis we can produce an histogram where we subtract to each nonce the lower bound of the subrange it belongs. This is the result:
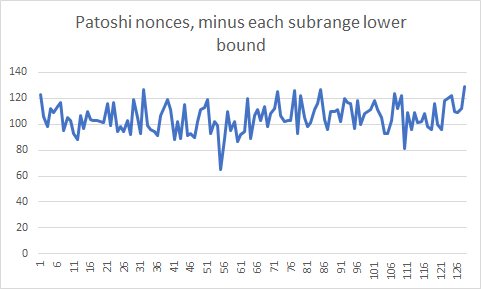
I can’t see a clear tendency towards higher or lower probability for higher nonces. I needed to be sure what I should expect from this histogram, and therefore I decided to simulate Patoshi mining.
Simulating Mining
I simulated mining a large part of Patoshi nonce space scanning sequentially in the range [19..58] (assuming 64% of hashrate), a subrange [0..9] (assuming 16% of the hashrate), and finally a single unit or punit range (assuming 1.6% of the hashrate). In all cases the miner increments the inner nonce. These are the results of the simulations:
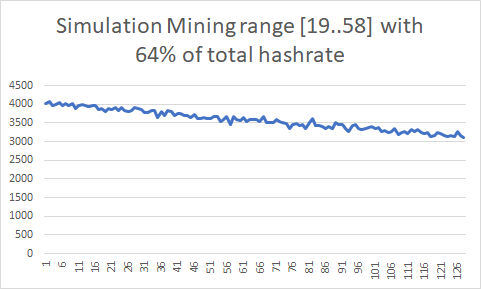
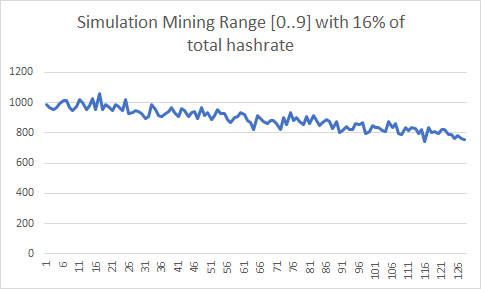
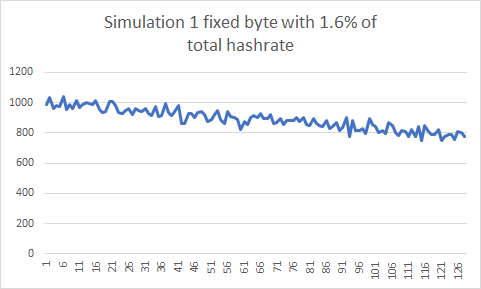
We can see in the first histogram that the last nonce has 25% less chance of being selected than the first nonce. In the second histogram the chances are reduced about 20%. For the unit range histogram, I increased the number of simulation events to get a more precise histogram. Again, the chance decayed 20% in the highest nonces. It seems that Patoshi was not resetting the nonce on new blocks. A new mystery? I needed a new method to analyze the histogram that was independent of the nonce starting point.
Re-Mining Comes to the Rescue
In 2014 I played with the concept of re-mining: searching for other solutions in the same space early miners found one. What can we learn from re-mining? Let’s imagine we find two solutions for the same block header. Let’s momentaneously assume that the miner does not update the block header timestamp nor the transactions contained in it until the blockchain grows by one more block and a new fresh header is created. We also assume that once the nonce hits zero or the maximum value, it wraps-around. When wrap-around happens, the extranonce is incremented and a new block header is built, producing a new nonce search space. The solution chosen by the miner, the one that exists in the blockchain, will be called the real solution. Let’s assume that the real solution is always the one with lower nonce compared to any other solutions found by re-mining. Then that would be strong evidence that the miner scanned the nonce space by incrementing the nonce and that the nonce was reset to zero at every new block. If the nonce found was always the highest one, then that would indicate that the nonce space was scanned by decrementing the nonce. Under the assumption that the header is not periodically updated and that we can find enough blocks with more than one solution to achieve statistical significance, it would be easy to detect the nonce scanning direction.
But the stated assumptions do not hold for the whole time required to scan the nonce space, but only for a short time, a short nonce range. This is because miners periodically increment the nTime field, which leads to the creation of a new block header. In the Bitcoin reference client version 0.1, the nTime field is updated every 0x40000 increments, as shown by the following code extract:
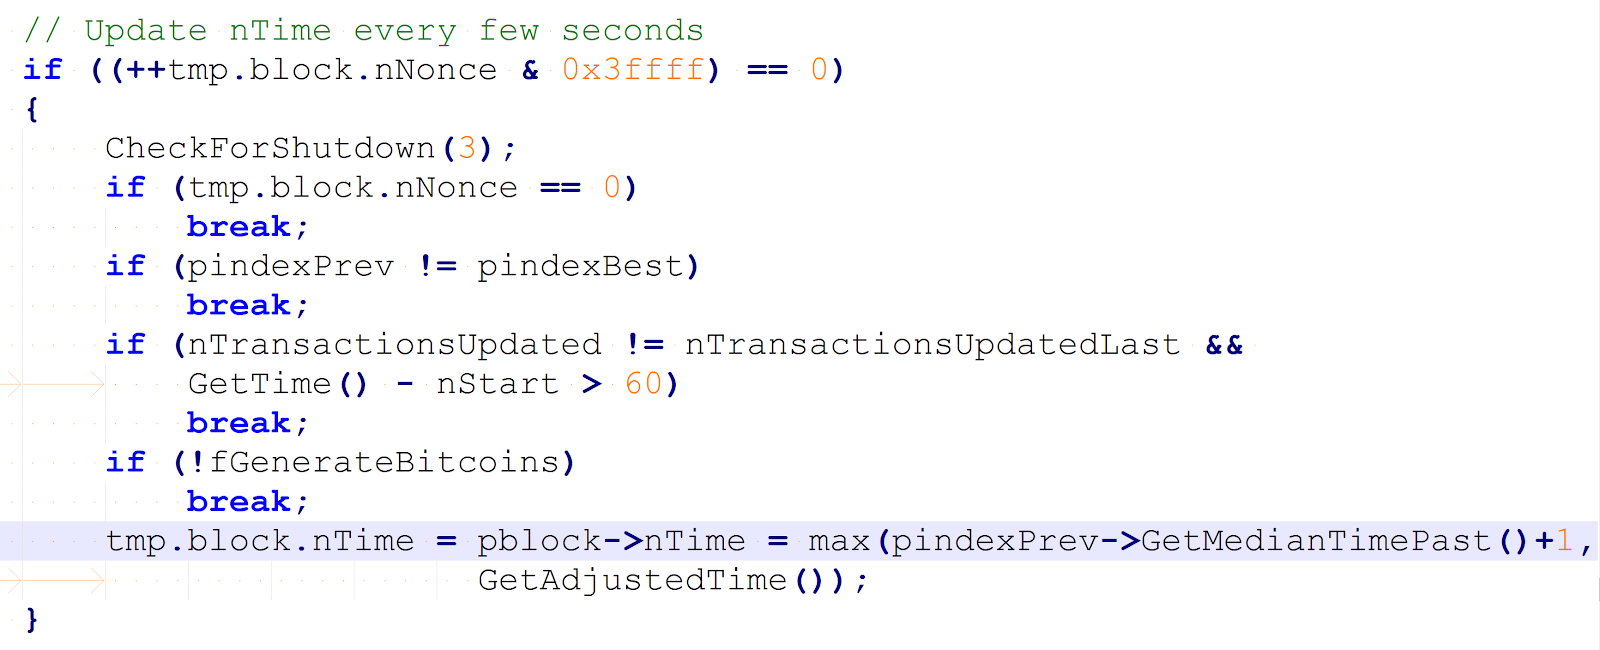 Code that periodically updates the nTime field
Each nonce interval where the block header is unchanged will be called a “nTime slot”. When sampling many blocks with multiple solutions, and looking at a nonce histogram, the percentage of lower nonces picked by the miner vs higher nonces found in multi-solutions can give us information about the size of the nTime slot size. When two solutions lie on different subranges, the percentage can also give us information regarding the parallel sequential relation of the two subranges: a percentage too high or too low would indicate a sequential relation, while a percentage close to 50% indicates a parallel search.
Let’s say we collect a large sample of blocks (i.e. >1000) with multiple solutions, and then we count, for each consecutive pair of multi solutions, how many cases the one with lower nonce is the real solution. We then divide this number by the total number of multi-solution pairs to get a percentage. Let’s call this percentage L. We define H as (100-L). If L is close to 50%, then that indicates the nonce is neither being clearly incremented nor decremented on a single sequence. It may indicate that the nonce was scanned using a non-standard method, such as a pseudo-random order, or a parallel search from different starting points. If L has a noticeable bias towards 0% or towards 100%, then we have credible evidence of a certain type of mining direction. The closer is L to 0% or 100%, the larger the nTime slot is. Note that if the nonce is never reset between blocks, so it restarts where it stopped, then L still provides the same information. This new method is invariant to the starting point!
We can make two assumptions regarding wrap-around-zero when scanning the Patoshi nonce range. If there is no wrap-around-zero, and a new header is created when the nonce reaches the subrange boundaries, then the block headers having a low nonce real solution have much higher probability to have an additional solution with higher nonce, while blocks having high nonce real solutions have much higher probability of having additional solutions with lower nonces. However, if the distribution of real nonces over the subrange is uniform, then these two cases would cancel each other and L would be unaltered by the boundary phenomenon. If L is biased towards 0% or 100%, then the boundary phenomenon will amplify the bias, because the bias close to the boundaries will not cancel out. Therefore L is a strong indicator of a sequential mining direction when there is one. If we assume Patoshi started mining at a random initial nonce, and only updated the header when he circularily reaches the starting point again after wrap-around a boundary,, then there is no bias amplification but still L is a good indicator of a sequential mining direction. If you’re are anxious to know the experiment result, just stay one more paragraph with me.
Some Useful Definitions
We introduce some more definitions to be able to present the results. As previously stated, the real solution of a specific block header is defined as the nonce that exists in the Bitcoin blockchain for that block header. Any other nonce that makes the same block header pass the difficulty test will be defined as an additional solution. Now suppose that we identify all non-Patoshi blocks that have more than one solution for the same block header (at least two distinct nonces that result in hashes below the difficulty target). We define this event as a multi-solution. Because in Bitcoin v0.1 the slot size is small compared to the nonce space, it’s highly probable that the solutions of a random multi-solution do not lie in the same nTime slot. If solutions lie on different slots, then there is no information we can extract from a multi-solution. For non-Patoshi blocks once every 16384 times (2^32/0x40000) an additional solution lies in the same slot of the real solution, and nTime will not be incremented in-between. Because a miner will on average scan half of a slot of the same block header, we can assure that, on average, a fraction of 1/(2*16384) of the nonce space of every block header does not contain an additional solution. Because in 2009 the block difficulty was 1, and because the number of solutions to be found is directly proportional to the number nonces tested, if we remine blocks scanning the full nonce space, we can expect to find an additional solution of any block with probability 32767/32768.
If we re-mine N blocks, we should find N * 32767/32768 additional solutions. For non-Patoshi blocks, it means that almost all blocks contain a second solution. Of course, some blocks will contain more than two, and some just one.
Here is the result of re-mining the first 18K blocks, and plotting the non-Patoshi multi-solutions found:
- Total non-Patoshi block: 1405
- Additional Solutions: 1176
- Multi-solutions: 793
- Lower nonce is real solution: 749 (H=94%)
- Higher nonce is real solution: 44 (L=5%)
These results confirm what the nonce histogram taught as: all non-Patoshi blocks are mined with an outer positive algorithm, such as the one existent in the Bitcoin public code. But what happens when we re-ming Patoshi blocks?
Surprise!
A month ago I started re-mining with a standard CPU. I don’t have access to a GPU nor an ASIC right now. I re-mined all non-Patoshi blocks in the first 18K block only to check that the theory matched the reality (It does). But things became not so clear when I re-mined Patoshi blocks. These are the results I got when re-mining all Patoshi blocks in the first 13.2K blocks of the Bitcoin blockchain. I’m searching the whole Patoshi range [0..9] plus [19..58] to scan for additional solutions.
- Total Patoshi blocks : 10025
- Additional solutions: 1075
Results for inner nonce
- Lower nonce is real solution: 222 (L=21%)
- Higher nonce is real solution: 789 (H=78%)
Results for outer nonce
- Lower nonce is real solution: 526 (L=51%)
- Higher nonce is real solution: 499 (H=48%)
If nonces were mined uniformly on the Patoshi range, and Patoshi was scanning the inner nonce, we get L=21%, so there seems to be a clear bias towards picking the highest nonce. This implies Patoshi was using an IN (Inner negative) scanning algorithm. I don’t have a sufficiently convincing explanation which Patoshi was decrementing the nonce instead of incrementing it.
If Pasohi was in fact decrementing the nonce, then the bias towards high real solution would increase if I reduce the range that I’m searching around the real solution. In fact, our initial assumption was that Patoshi scanned the subranges in parallel. Here are the results obtained for the different subranges:
| [0..9] | [19..28] | [29..38] [39..48] | [49..58] | ||
| H | 97% | 97% | 94% | 97% | 95% |
Number of cases the highest nonce is chosen by Patoshi within a subrange
Whenever I test a range which lies in the middle of the subrange boundaries (i.e. [25..34]), H moves towards 50%. It never reaches 50% because when two solutions lie in the same subrange, they are still dependent and show the preference for the highest nonce being the real one.
I also tested the cross-interval solution dependence between the range [0..9] and the range [19..28]. There are not so many multi-solution cases which have one solution in the upper range and another in the lower range (only 75). The result was L=38%, which indicates there could be certain dependence, but it’s not sufficient due to the small sample size.
Because the bias towards picking the highest nonce is significant, we can conclude there is a high dependency in multi-solutions. This suggest two things:
- Patoshi updated the nTime field infrequently during mining (as infrequent as once a minute).
- Patoshi scanned each subrange in parallel, but within each subrange, he scanned each subrange sequentially.
The theory that Satoshi had 50 networked seems to contradict the results.
While it’s possible to use the multi-solution distribution to estimate Patoshi nTime slot size or even try to guess the number of sequential ranges scanned, I leave that research for a future article.
Since reversing the header fields in software takes very little time compared to double hashing the header, I suspect Patoshi had optimized the miner a lot more than previously thought. You would only perform the nonce increment close to the SHA256 assembly code if it provides a meaningful advantage. Another reason may be that the scanning was performed on special programmable hardware, such as an FPGA, so wasting gates to reverse the nonce is pointless, and those gates can be used to add more hashers. However, the hashers must have been mining consecutive block nonces (“pipelining” like CPU-miners do with SSE2) and not scanning multiple intervals in parallel. This theory is plausible since SHA256 implementations for FPGAs have been available since 2005. In my opinion, it’s plausible that Patoshi had already performed other more evident optimizations, such as removing the hashing of the first chunk (which stays constant) and start mining from the SHA256 mid-state, and parallelizing the hashing with multiple-threads or SSE2 pipelining.
Flawed Estimations
I missed the opportunity to test re-mining in 2014. My conclusion in 2014 was that I could learn very little from re-mining because the nTime would be changing too fast to expect more than one solution belonging to the same nTime slot. But it turned out I was wrong, for two reasons. First, I knew that Patoshi mined with a different software than the reference code but I was still assuming his code would be using an nTime slot of size of 0x40000. He was clearly not. Second, I didn’t take into account that even if the nTime were to be updated in sub-second intervals, the resolution of the nTime is just 1 second, so sometimes the updated value would be the same value that existed before.
Summary
In this article I solved the mystery of the Patoshi range boundaries, showing that the boundaries are not aligned with powers of 2, but with multiples of 0x4000 * 10^4. I presented several histograms that do not show a clear exponentially decaying (or exponentially increasing) probability of nonces in Patoshi blocks. I simulated different standard nonce scanning algorithms and realized that all of them produce certain imbalance in the nonce histograms, yet the real Patoshi nonces do not present a clear imbalance. The reason for this mismatch could be that Patoshi’s mining machine did not reset the nonce between blocks, spreading the solutions more uniformly over his mining range, but I couldn’t find evidence of this property. Finally I executed a new experiment: I re-mined Patoshi blocks in order to find additional solutions. I had proposed this experiment in 2014, but I wrongly disregarded it as ineffective. However, it turned out that re-mining reveals a strong tendency of the Patoshi mining algorithm to choose higher nonces when scanning the inner nonce. This tendency suggests the nonce was being decremented, which is the opposite that the Satoshi client version 0.1 does. Since the nonce imbalance decreases when analyzing two subranges together, this suggests Patoshi was scanning the 5 subranges in parallel, but each subrange internally sequentially. This contradicts a theory that Patoshi deployed the first mining farm of 50 independent computers (or any other highly decoupled system) and supports the theory that Patoshi was simply multi-threading in a high-end CPU.
Special thanks to Raul Laprida for helping me with the article.
Edit: Kim Nilsson found the real Patoshi boundary before me. He sent me an email in January stating that “Patoshi’s nonce is a big-endian number partitioned into ranges of 163840000 values, where only certain partitions are searched while mining.”. Sadly I didn’t pay enough attention that 163840000 was not exactly 2^24*10, nor I understood what he meant by big-endian, and so I had to spent time coding and researching myself 😦. I wish I had understood.
Thanks Kim Nilsson for letting me know and I apologize for not citing your work before!