
The Cost and Sustainability of Bitcoin
The Cost & Sustainability of Bitcoin
By Hass McCook
Posted August 1, 2018
This paper was transcribed from a .pdf and the editor did his best to make sure all charts came over in correct fashion. We wanted to include a direct download link to Hass’ paper in case you’d like to see this in the raw whitepaper form.
Foreword
To understand the nature of Bitcoin and its ties to energy (spelled with a lower-case e), one needs to understand the concept and nature of “Capital-E” Energy . Energy is the prevailing force in the universe - both Father Time and Mother Nature. It cannot be created or destroyed, only transformed from one state to the other. It is the finite but infinitely divisible, shape-shifting sole ingredient of the universe. Its force cannot be stopped, only harnessed through its good graces. The Big Bang can be considered the “Birth of all Energy and Laws of Nature”. Bitcoin’s “Big Bang” was the codified creation of 21 million coins, of which 50 were discovered in the mining of the Genesis Block . Since then, 17 million have been discovered, with the rest to be mined in a predictable manner over time.
Energy is split infinitely into units of lower-case energy and mass (calories, joules, pounds, kilograms etc.), just as Bitcoin is infinitely split into units of bitcoin – no mass, just energy . From here, the link between Energy & Bitcoin becomes evident when looking at Nature and Life, and the economic evolution of humans.
At the most primal level, the first instinct of Life is to survive. Energy is Life, and Life is sustained by energy. Plants get their energy from photosynthesis. Predators do this by consuming more calories than they used to hunt their prey. Human Civilisation has evolved to the point where we can transform Energy into a state of Power (fire, steam, coal, batteries, fuel cells, etc). This has taken us from harnessing fire to cook food millennia ago, to much more capable energy sources now. Thanks to all the energy we produce, Humans now expend their calories in the pursuit of currency and money to purchase their food calories and other things required for survival and store the rest for future use.
There are huge differences between currency and money . Money is finite, whereas currency is not, and can therefore be compared to energy, and retains its stored energy over time. When the Gold Standard was abandoned, our paper currency became backed by nothing but promises. Ever since then, the value of currency has tended to zero, and money to infinity. Currency violates the rules of Energy by being created out of nothing (aside from the comparatively infinitesimal energy used to print out currency and mint coins). Disrespecting nature has led to dangerous levels of global wealth and income inequality, and widespread social and economic suffering. No form of life has defied Energy and survived in the long term, and this has been the case for billions of years.
Cryptocurrency is the “ Life” of money, of which Bitcoin was “first-life” – literally converting energy into money. It has evolved to keep meeting market needs and sprouted a thriving cryptocurrency ecosystem. Bitcoin was designed to last as long as humans do, wherever they are in the universe with a communications link. Obviously, in the distant future, if humans have stood in the face of Energy and not harnessed it in a clean and renewable way, they will perish. Therefore, as we continue to advance technologically, the Bitcoin Blockchain will be a permanent emissionless store of “ monetary energy” – money secured and proven to be both finite, and earned through hard work (literally, “Proof of Work”), using massive amounts of energy in the process.
Executive Summary and Preface
All data used in this paper is as at Block 534,240, mined on 29 July 2018. Network Difficulty was roughly 5.95 trillion. Hash Rate was roughly 42.6 EH/s. Price on the Bitfinex exchange was roughly USD$8200. The changes in mining ecosystem metrics since January 2015 are shown below:
| Metric | January 2015 | July 2018 | Change |
| $/GH | $0.65 | $0.037 | -94% |
| W/GH | 0.89 | 0.098 | -89% |
| Network Hash Rate | 295.4 | 42587.7 | 14317% |
| Price | $200 | $8,200 | 4000% |
This paper serves to update the assumptions used in a prior version of this research from February 20151, and provides a systematic methodology of modelling the environmental and economic costs of Bitcoin. Furthermore, the paper will provide a thorough discussion on the economics of Bitcoin mining to support the underlying model assumptions. Comparative data with the Gold Mining industry will also be revisited.
Based on the assumptions set forth in this paper, the model has estimated the average cost to mine one bitcoin to be roughly $6,450 . It should be noted that this research is an inductive, bottom-up estimate, with the intent to provide a ball-park estimate. A sensitivity analysis has also been undertaken to demonstrate range of costs under different scenarios, which shows a realistic range of average mining cost of between $5400 (driven by aggressive electricity price assumptions), and $7500 (driven by hash rate increase assumptions). Due to the nature of competition in the Bitcoin mining market, costs that are significantly higher than the market price of Bitcoin can generally be ignored in the short term.
Major Assumption Updates
- The previous version of this research omitted the cost and impact of air-conditioning to the network, so the tonnage of CO2 was underestimated by over a third. It also did not capture the impact of manufacturing, packaging and air-freight transportation of ASIC mining rigs, or the impact involved in the resource extraction or recycling process. The new methodology set forth in this paper captures these items, and the result is a Bitcoin network that exhales 63 million tonnes of CO2 per year – about 0.12% of global greenhouse gas emissions2,3,4 (37 Gt CO2 + 16.5 Gt CO2e). Of the 160,000 TWh of energy generated globally each year5, the Bitcoin Network chews through about 105 TWh/year (0.0661%). It should be noted that all figures include the impact of the manufacture ofASICs, which represent over 50% of all emissions generated.
- In early 2015, the fee market was almost non-existent. In 2015, the average daily miner’s fee revenue was 22.4 BTC. For the six years between 2009 and 2015, the average was only about 15 BTC. In the past 6 months, daily revenue has been very consistent, hovering at just under 50 BTC/day. To that end, this extra revenue has been accounted for in this update.
Acknowledgements
Thank you to Lena Klaaßen for her review of my methodology and calculations.
Bitcoin Economics
Organizational decision-makers set their strategies in line with their firm’s microeconomic, macroeconomic, and global competitive contexts. In the case of a Bitcoin mining firm, the context is as follows:
- Microeconomy: All other Bitcoin mining firms
- Macroeconomy: All other Bitcoin ecosystem members
Global-Macroeconomy: All other digital and non-digital assets and global fiat monetary systems
This chapter defines the nature of competition within these three contexts and will assert that the nature of competition in the Bitcoin mining industry is perfectly competitive in the long term. This will lead into discussion on the strategic machinations of bitcoin mining firms, through comparison of empirical data and academic theory on firms in perfect competition.
Bitcoin Mining in the Global Monetary Macroeconomic Context
The Global Macroeconomy (GM) is the all-encompassing sum of all monetary systems, from traditional “analogue” financial systems, to digital ones like Bitcoin. All exchanges of value, legitimate or not, occur within it. Firms within the Bitcoin mining market service the Bitcoin ecosystem and depend on it being healthy and diverse in order to prosper6 .
” [Accelerated] globalization [has] yielded conditions of considerable oligopoly in the world economy“7 . Some criticize the legacy system as the inadvertent/deliberate proprietor of global inequality8, 9, with ever-mounting barriers to entry deterring the emergence of competing monetary systems. History shows that Schumpeterian gales of creative destruction eventually blow these barriers away10 . In the case of the GM, this was the invention of The Blockchain, of which Bitcoin11 is the first and largest implementation12 . At that moment in history, the GM effectively split into the pre-2009 “analogue” GM, and the parallel digital one. Due to age, complexity, and nationalistic necessity, the legacy GM can only experience bursts of improvement13 and remain a “closed ecosystem”14,15 . In the highly competitive-yet-collaborative open-sourced decentralized digital ecosystem, anyone in the world can collaborate with others or create new or copycat ecosystems through the open-source software movement16, ensuring evolution and adaption to changing market needs.
To that end, Bitcoin mining firms operate almost exclusively within the digital Global Macroeconomy, and the Bitcoin Mining Market in particular. They have an eye towards alternative digital ecosystems that are gaining traction in the wider free market, and whether their mining equipment can also mine these alternative digital currencies. The competitive cycle between them and their peers resets roughly every fortnight17 .
Bitcoin Mining in the Bitcoin Macroeconomic Context
The Oxford Dictionary defines an economy as “ the state of a country or region in terms of the production and consumption of goods and services, and the supply of money”. Since “country” or “region” do not apply to digital ecosystems, it is difficult to use traditional macroeconomics which rely exclusively on the concept of an influential controlling body to analyse them.
Bitcoin’s monetary policy is highly predictable and based on a consensus-based, cryptographically secure, selfmanaging algorithm18 . Bitcoin firms can move to the physical jurisdictions that provide the best incentives (i.e. low power, favourable business and tax laws, etc.). In the legacy global financial system, this option is only available to large multinational corporations19, with most consumer-level participants lacking the mobility to move to the jurisdiction of their choosing20 . This is inherently different in a permissionless, online, jurisdictionagnostic environment.
Bitcoin’s ecosystem is still small and fragile, but its incentive structure becomes more robust as more participants are attracted to the ecosystem6 . Rational Bitcoin miners want to see the demand for their commodity grow organically and sustainably, but this is difficult. Miners mine an intangible digital commodity whose fundamental value relies on a consensus-based economic protocol and network. Its market price is based on the whim of the market. Every shock to the ecosystem, such as failure of wallet services and product providers21, at least 36 exchanges22 including the disastrous MtGox collapse23; online drug markets24, Government crackdowns25 and auctions26; scam-coins27, developers28, even miners themselves29, and everything else in a long list of Bitcoin disasters, has in several cases caused dramatic and sudden movements in the price of the commodity30 . Considering the evidence, Bitcoin is an example of an anti-fragile31 system, with bitcoin achieving year-on-year growth in most key metrics32,33 despite the numerous aforementioned setbacks. When and if the market becomes large enough to be less vulnerable to shocks, consolidation through means of integration and merger-and-acquisition activity amongst firms will be witnessed59, as will be discussed in the next section.
Perfect Competition & Bitcoin Microeconomics
The example of “the hypothetical firm in a perfectly competitive market” is taught in most introductory economics classes. A literature review of primary academic texts34,35,36,37,38,39 identifies nine conditions that define a perfectly competitive market:
| Homogeneous products | no barriers to entry or exit |
| guaranteed property rights | many buyers and sellers |
| non-increasing returns to scale | perfect information |
| zero transaction costs | no externalities |
| perfect factor mobility |
When compared with real world data, the Bitcoin mining market (BMM) does not meet all aforementioned conditions of perfect competition, due to a relatively low number of ecosystem participants, currently resulting in wealth and information asymmetry. However, the BMM is trending towards becoming perfectly competitive as the wider Bitcoin macroeconomy grows, which will now be demonstrated.
As at date of writing, the BMM satisfies six criteria of a perfectly competitive market. Bitcoin’s nature as an open-source, encrypted, distributed ledger means that the blockchain guarantees property rights and homogeneity, at zero or near-zero transaction and storage cost40 . The factors of production (labour, equipment, and capital) are mobile to the extent that only a communication link and a power source is required to participate in the ecosystem. Due to its economic incentive mechanisms11, any mining entity approaching 50% of network hash rate (NHR) would experience non-increasing returns to scale, if not jeopardize its own existence, as witnessed during the GHash.io saga of 201441 . Developing on top of Bitcoin requires no permission, and if entrepreneurs have a good enough idea, securing start-up capital is not a difficult barrier to entry to overcome, with over one billion US dollars invested in Bitcoin start-ups to date42 . Low barriers are also commonplace in very young markets, with imitative entry into the market quite rampant43 . Conversely, barriers to exit are quite low for most market participants except for heavily leveraged or undiversified miners, who risk holding highly specialized computing equipment that may be unable to mine other digital commodities. This is no different to traditional undiversified commodity miners44 .
The satisfaction of the final three conditions relies solely on the growth of the network and passing of time. The current size of Bitcoin’s user base is speculative, and always will be due to its pseudonymous nature. CNBC reported45 that 8% of American adults had invested in cryptocurrency (or, 8% of 250 million people46 = 20 million). Yahoo Finance reported47 that 16.3 million Americans buy and sell bitcoin frequently. Coinbase reports that they have over 20 million users48 . Meanwhile, in some parts of Europe is estimated that an average 4% of consumers use cryptocurrency as a payment method every day as of 2016, with Eastern Europe leading the charge at 11%49 . The numbers play out as follows50:
| Country / Region | Adult Population (millions) | Users as % of Population | No. Bitcoin Users (million) |
| USA | 250.0 | 8% | 20.0 |
| Eastern Europe | 260.7 | 11% | 28.67 |
| France | 56.8 | 4% | 2.27 |
| Germany | 73.4 | 2% | 1.47 |
| UK | 57.6 | 1% | 0.58 |
| Spain | 41.5 | 2% | 0.83 |
| Switzerland | 7.6 | 2% | 0.15 |
| Benelux | 25.8 | 2% | 0.52 |
| Total 54.5 |
Table 1 - No. of Bitcoin Users - High Estimate
When adding US and European numbers, and noting that data for Asia, Africa, Latin America, and Oceania are omitted, a high estimate of over 50 million users can be made. Although this sounds like a market with “many buyers and sellers”, 50 million people only accounts for 0.8% of the World’s adult population50 . A much lower estimate of between 2.9 million and 5.8 million has been highlighted in a very detailed assessment of the global cryptocurrency market produced by Cambridge University in April 201751 (granted, things have changed dramatically since April 2017 when price was only USD$1000, right before the “big hype” of late 2017, where a significant number of new users would have come into the ecosystem).
From a commercial markets point of view, a strong case can be made that a few participants have an inordinate, albeit temporary, grip over pricing and information. The temporary nature is shown in the table below, comparing wallet balance distribution since December 2014. We can see that there has been a flatting of the distribution of coin holdings away from large wallet balances to much lower balances. As can be seen, coins held in wallets with balances containing between 0.001 to 10 BTC have grown dramatically, and it could be expected to resemble a normal distribution as the decades move on.
Dec-201452 Jun-201853
| Balance | % of all BTC | % of all BTC | Δ |
| 0 - 0.0001 | 0% | 0.01% | - |
| 0.001 - 0.01 | 0.02% | 0.12% | 500% |
| 0.01 - 0.1 | 0.16% | 0.73% | 356% |
| 0.1 - 1 | 0.85% | 3.23% | 280% |
| 1 - 10 | 4.76% | 8.70% | 83% |
| 10 - 100 | 26.73% | 25.57% | -4% |
| 100 - 1,000 | 23.40% | 21.80% | -7% |
| 1,000 - 10,000 | 23.40% | 19.92% | -15% |
| 10,000 - 100,000 | 17.02% | 17.28% | 2% |
| 100,000 - 1,000,000 | 3.66% | 2.64% | -28% |
Table 2 - Distribution of Coins (by wallet balance)
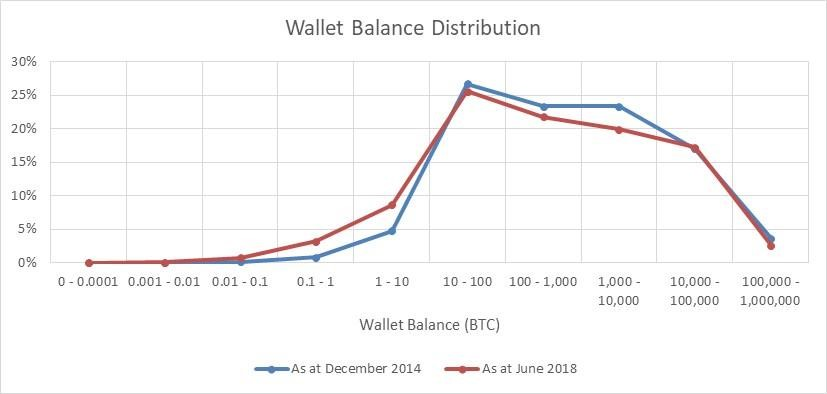 Figure 1 - Distribution of Coins (by wallet balance)
It should be noted that all wallets with a balance of over 100,000 coins belong to identified exchanges / custodial wallets53 . The identifiable custodial wallets, alongside their “total wallet balance rank”, is as follows:
| Rank | Custodian | Qty BTC | Rank | Custodian | Qty BTC |
| 1, 441 | Bitfinex | 175,172 | |||
| 2 | Binance | 174,759 | |||
| 3 | Bittrex | 117,203 | |||
| 4 | Huobi | 98,042 | |||
| 5 | Bitstamp | 97,848 | |||
| 28 | Coincheck | 34,277 | |||
| 55, 58, 117, 125, 167 | Kraken | 70,805 | |||
| 177, 447 | Xapo | 8,911 | |||
| 264 | AnxPro | 4,712 | |||
| 353 | Bitmain | 3,372 | |||
| 255 | BitX.co | 4,966 | |||
| Identifiable Coins in Custody | 790,067 |
Table 3 - Bitcoin Held in Identifiable Custodial Accounts
The above table does not include coins held in custody by other major custodians such as BitMex, Poloniex, Coinbase, and others. It is expected that a lot of wallets with very large balances are custodial wallets, especially as those wallets have several hundred inputs and outputs over a short period of time, which means that the distribution may be even flatter than demonstrated above. A study of Bitcoin Unspent Transaction Outputs (UTXO) by Unchained Capital54 studying the shift of old coins into new hands over time, noted that 15% of BTC moved out of wallets that had been dormant for 2 to 5 years during the 2017 Bitcoin rally. This trend of a flattening in distribution is expected to continue, as spent bitcoin is spent forever, and needs to be earned back.
Bitcoin’s current major externality is the CO2 emitted by hardware operating and securing the network, which is discussed in depth over the next few chapters. Therefore, as the world moves towards carbon-free energy sources over the coming centuries, in additional to cleaner and more efficient mineral mining and e-waste recycling technology, Bitcoin’s CO2 emission externalities will eventually tend towards zero. Based on strong and predictable trends indicating technological improvements driving down costs of renewables55, as well as the potential for fossil fuels to be priced fairly (i.e. more expensively) under future carbon trading schemes56, we may witness a more expedient migration to renewables. As history has shown several times, the death of an incumbent technology is swift when displaced by something better57 .
Bitcoin is not perfectly competitive in its current state but is very close to becoming so. The first six of the above conditions are met in the short-term, with the last three destined to be met (if not already partially met), should Bitcoin have a “long-term”.
Most importantly, in a perfectly competitive environment, marginal cost to produce a good (MC) is equal to the marginal revenue from selling that good (MR), i.e., in long-term equilibrium, cost to mine will be equal to the price of a bitcoin, and in the short term, this equilibrium point will be established by the market.
Perfect Competition & Managerial Economics
The Porter’s Five (or Six) Forces58 framework is a mainstay of the MBA Curriculum. The forces within the Bitcoin mining market are illustrated below.
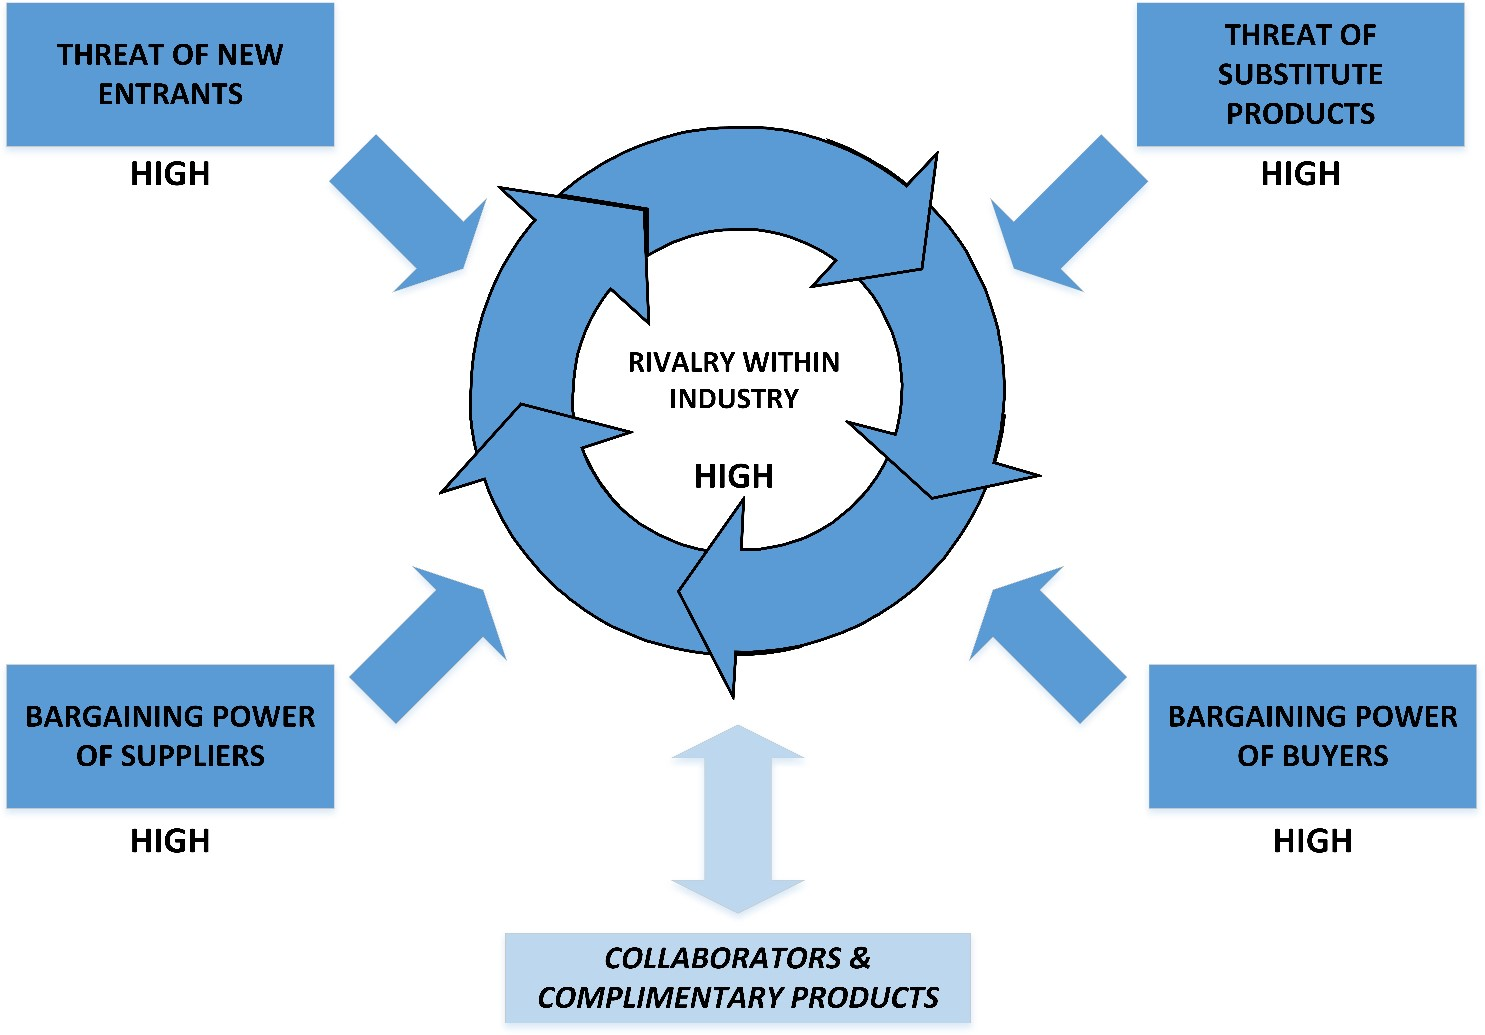 Figure 2 - Porter’s Five Forces Analysis of the Bitcoin Mining Industry
Mapped out, prospects look quite daunting for an industry competitor. They cannot easily protect themselves from new miners or substitute products such as other digital currencies. They are price takers with little power over their buyers, and unless they are an innovation leader in the fields of hardware manufacture and research-and-development, data centre ownership, and/or electricity provision, they have little control over their suppliers too. As mentioned previously, collaborators (i.e. other ecosystem participants) currently have equal potential for benefit and detriment whilst the market is still susceptible to shocks. Competition is stiff within the mining industry, and a prompt extinction awaits if you are not a cost or innovation leader57 . This is expected - economic profit tends to zero in long-term equilibrium in a perfectly competitive landscape34, and the marginal cost of producing and the market price oscillate around an equilibrium point34, with evolution and improvement the only way to stay in business. In such competitive markets, there is also a natural tendency for the market to be dominated by three or four players59,60 . The Pareto Principle, also known as the 80/20 rule61, states 20% of the market participants control 80% of the market. In November 2015, the 5 largest pools provided 79% of mining power. In June 2018, the largest 5 provided 70% of hash rate, with 78% of power coming from the top 6. That said, the pools are not monolithic entities.
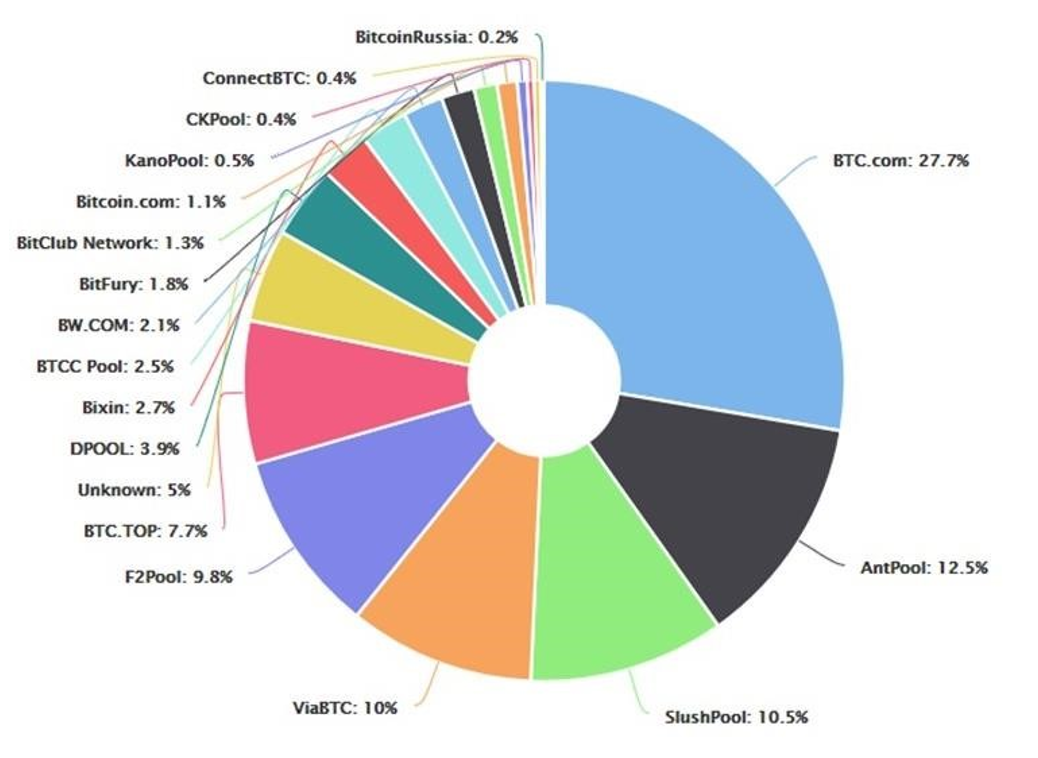 Figure3 - Bitcoin Network Hash Rate (NHR) Distribution
In a perfectly competitive market, a firm’s decisions are predictable. All firms need to decide to start up, how to run their business as cost-effectively as possible, and whether to stay in business or not. In the Bitcoin world, the decision-making process relies on market price of bitcoin, operating expenditure, and the network hash rate, i.e., how much competing “mining” power exists on the network. It also indirectly relies on the continued faith and investment of miners in the value of their commodity i.e. continued research, development, capital expenditure, and strategic partnerships with collaborators. Table 4 shows the relationship between hash rate and price and shows the outcomes for miners in six different scenarios.
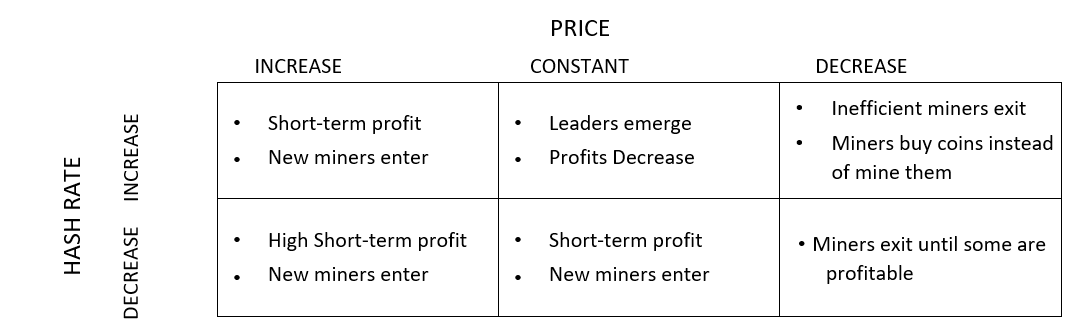 Table 4 - Price - Hash Rate Relationship Matrix
Effectively, if price of the commodity (i.e. demand) increases well beyond the cost to mine the commodity, miners will enter the market until the price and cost are equal. If price decreases, miners leave the industry until there are only profitable miners (i.e. either cost or innovation leaders) remaining. If price is dramatically lower than cost to mine, some miners may elect to simply buy bitcoin up to the current cost to mine. If the market is flat, profit tends towards zero until the market is shaken up again. This is similar to the workings of physical commodity miners in the commodity63 and oil64 industries. The difference is that a Bitcoin firm’s decisions take hours and days to implement, and days and weeks to take effect, instead of months and years. The same is true regarding the time taken to reach equilibrium after a price shock; “two-to-four times the duration of the production-to-storage cycle” (i.e. months to years) for commodities65, weeks for Bitcoin.
Trends & the Future
Since the future appears full of opportunities for the digital macroeconomy, one should expect digital microeconomies to become more perfectly competitive as time passes. Should long amounts of time, say, 50 years pass, when all bitcoins have effectively been mined, and the ecosystem is still healthy and has entered the redistribution stage, microeconomies such as the bitcoin mining market will start to resemble the textbook examples of perfect competition. In time, miners will vertically integrate backwards66 by acquiring data centres, chip fabricators, research-and-development teams, and renewable power plants; and integrate forwards by acquiring exchanges, brokers, and other places to sell what they have mined. They can horizontally integrate66 by acquiring entities that enrich the value of their commodity such as wallet hardware and other product manufacturers, financial services companies, and media outlets. 80% of the market will be controlled by the 20% of the largest and most integrated market participants61, with the other 80% providing the niche and evolving needs of the market. As time goes on, the makeup of the microeconomy will evolve until its extinction and replacement10 .
Now that you have a very thorough understanding of the market, and what is going through a miner’s mind, the focus of the paper will shift to the cost of mining Bitcoin.
The Evolution of the Bitcoin Mining Industry: January 2015 – Now
Mining Technology
Since the last analysis, Bitcoin mining technology has improved dramatically. The benchmark used back then was Bitmain’s Antminer S5. We will look at the S5 compared to its current successor, the Antminer S9i67 .
| January 2015 | June 2018 | % Change | |
| Network Hash Rate | 295.4 PH/s | 36346.2 PH/s | +12,200% |
| Retail-Best Miner | Bitmain Antminer S5 | Bitmain Antminer S9i | |
| $/GH (RRP) | $0.65 | $0.047 | -94% |
| W/GH | 0.89 | 0.098 | -89% |
Table 5 - Evolution of Mining Technology
Further to the above, one of Bitmain’s closest competitors, Canaan Creative, comes in with a lower $/GH rate ($0.044) when excluding PSU costs from both rigs, but a 15% higher W/GH value (0.109)68 . As the market will tend to gravitate towards the lowest total price available, it’s expected that Bitmain controls and ships significantly more hardware than Canaan91 .
Hash Rate Growth
The dramatic drop in $/GH and W/GH shown in Table 5 has spurred extraordinary hash rate growth. That said, this is not a new phenomenon.
Figure 4 shows hash rate growth since the Genesis Block in 200969, showing steady and consistent exponential growth of the network. One of the main drivers of investment in mining equipment is expected hash rate growth from one difficulty cycle to the next. We will explore this concept in further detail in the next chapter. Table 6 shows how consistent fortnightly hash rate growth has been over the past 6 and a half years. Network difficulty grows directly in line with hash rate growth.
| 2012- Current | 2013-Current | 2014-Current | 2015-Current | 2016-Current | 2017-Current | YTD | |
| Average | 9.0% | 9.9% | 7.0% | 5.3% | 5.9% | 6.8% | 7.2% |
| St Dev | 9.9% | 10.2% | 7.3% | 6.1% | 6.4% | 6.7% | 5.7% |
| Sample Size | 187 | 161 | 130 | 100 | 73 | 46 | 17 |
Table 6 - Average Difficulty Change Data
As a result of the constant hash rate increases, the difficulty cycle is rarely 14 days, and based on rough year to date data (7.2% increase per cycle), the difficulty cycle is closer to 14 days x (1 – 7.2 %) = 13 days, or 312 hours.
Should Bitcoin ever scale and reach its potential, it is almost certain that mining equipment will exponentially increase in processing efficiency in line with Moore’s Law for at least another 5 years70 and exponentially increase in power efficiency in line with Koomey’s Law for at least another 25 years71 .
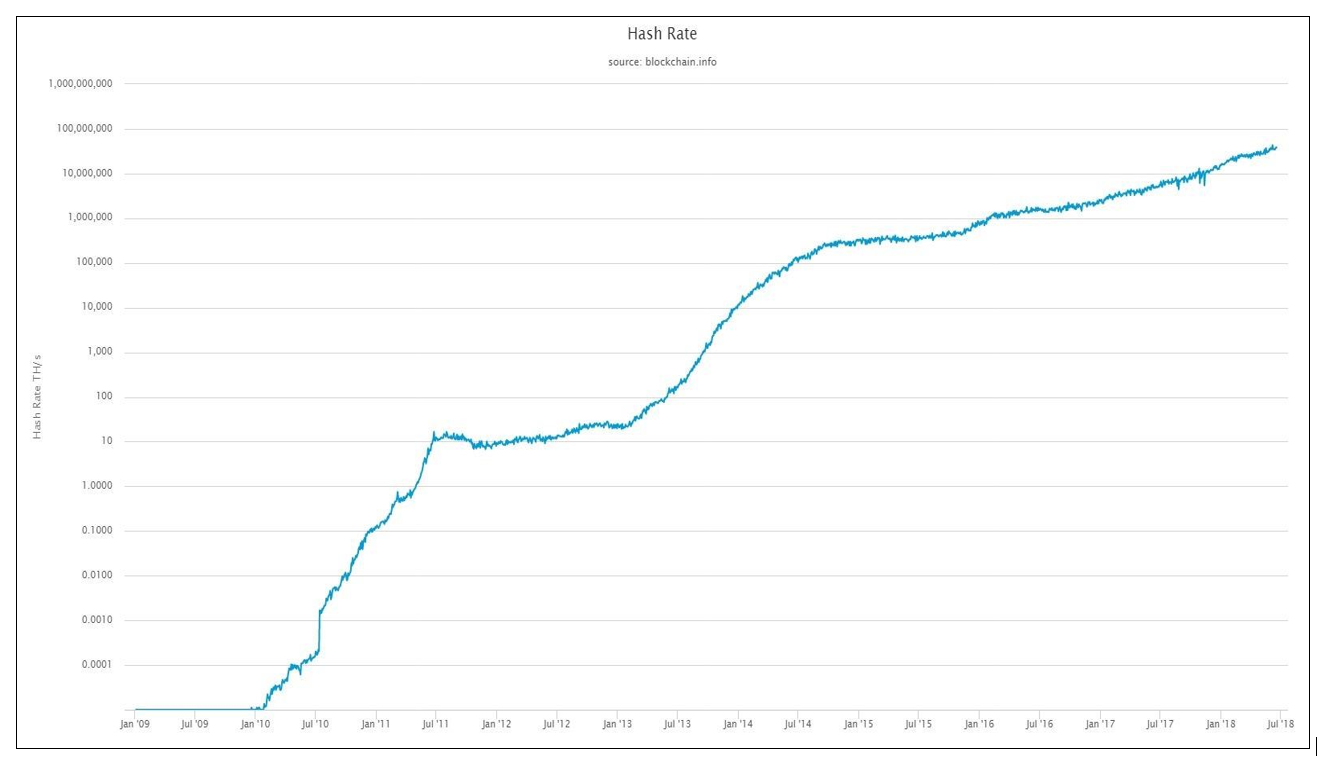 Figure 4 - Network Hash Rate - All-time Data (Log Scale)
August 2018 Edition 10
Understanding the Cost of Bitcoin – Inputs & Drivers
Calculating the costs of Bitcoin can be modelled quite simply through the relationship of the 7 variables defined below.
Economic Cost Inputs / Drivers
CAPEX
CAPEX is the capital expenditure required to maintain a proportional share of mining rewards upon an increase in difficulty. This is typically the purchase of additional GH/s at a particular $/GH rate. This is demonstrated in the below example, assuming the average of 7.2% difficulty increase discussed above:
| Current Difficulty Cycle | Next Cycle (Predicted) | |
| Network Hash Rate | 1000 PH/s | 1072 PH/s |
| Hash Power Provided by Miner / Mining Pool | 300 PH/s | 321.6 PH/s |
| % of Hash Rate provided by miner | 30% | 30% |
Therefore, for the example mining pool to maintain their 30% slice of the pie, they need to bring on 21.6PH/s of hash power.
There are other elements of CAPEX whose life-cycles are much longer than mining equipment. These elements of CAPEX can also be deemed as “sunk costs” in many cases, and don’t affect future decisions. The CAPEX categories are as follows:
- Bitcoin Mining Equipment (typically last for only a few months before they’re unprofitable)
- Power Supply Units (PSU) for mining equipment typically last as long as the mining equipment due to planned obsolesces, with hardware manufacturers regularly changing the required PSU wattage with each new generation of miner.
- Server Racking / Data Centre Construction & Fitout Costs (typically last for decades). Server Racks / Data Centres could also come under Operational Expenses (OPEX) if the Data Centre is being rented / leased. Regardless, these costs are negligible compared to the costs of electricity.
OPEX
OPEX is the expenditure required to remain operational. At scale, this is effectively just the cost of power to the mining equipment and air conditioning within a data centre. It is estimated that cooling can consume 3072 to 40%73 of overall energy consumption, with 21% a benchmark for the most efficient cooling systems74 . Technologies such as immersive cooling will reduce energy consumption as a trade-off for a large initial capital outlay. One should take in account the “Iceland Factor”, where Bitcoin mining uses as much power as all of Iceland’s homes75 due to it being cold enough for data centres to meaningfully reduce cooling costs and having clean and cheap hydro-electricity. At 840 GWh/yr., tiny Iceland would account for about 1% of the world’s mining power. While Iceland is only a very small share of the market, miners have access to several other cold places with cheap electricity76 . For the purposes of this model, we will assume cooling contributes to 20% of the total power consumption, in line with the laws of perfect competition and the technological gravitation towards maximum efficiency.
Difficulty Cycle Length
Network difficulty changes every 2016 blocks. At a fixed hash rate, blocks will take 10 minutes (on average) to mine. This results in a difficulty cycle of 14 days. However, as the network hash rate increases 7.2% on average, blocks will be mined, on average, 7.2% quicker. Therefore, the time-period used to calculate the cost of mining a bitcoin will be the average time between difficulty changes will be taken as 13 days (14 days x 92.8% = 13.00), or, 312 hours.
Coins Mined
This is a fixed number – there are 2016 blocks of 12.5 bitcoins mined every difficulty cycle – 25,200 bitcoins. In addition to the mining rewards, mining fees are not insignificant either77 . The SegWit Wars of the first half of 2017 had fees averaging over 200BTC per day, and the fee madness during the hype cycle of December 2017/ January 2018 had a revenue average of over 550BTC per day over those two months. With the SegWit wars over, and the hype now well settled, a relatively consistent 40 BTC per day has been earned in the 6 months leading to July 31, 2018 (st dev = 35, n=180). Daily average fee revenue trends over time are shown in the table below. For this model, we will use a figure of 650 BTC collected in fees each cycle (i.e. about 50/day for the average 13-day cycle time).
| 09-‘12 | 2013 | 2014 | 2015 | 2016 | 2017 | 2018 | Since Halving | |
| Avg | 6.57 | 43.31 | 12.92 | 22.42 | 62.38 | 273.51 | 105.45 | 177.93 |
| St Dev | 11.46 | 26.12 | 3.83 | 8.35 | 29.34 | 171.55 | 181.47 | 180.42 |
| Sample Size | 730 | 182 | 183 | 182 | 183 | 183 | 211 | 768 |
Table 7 - Daily average fee revenue over time
Power Cost & Emissions
To evaluate power costs and emissions, we don’t have much of a choice but to use world-wide weighted average figures, due to the dispersion of miners all over the world. That said, thanks to the rules of perfect competition, particularly perfect factor mobility, miners will move to places with the cheapest electricity costs. The statistics are as follows78,79,80,81 . The emissions figures consider CO2 equivalents, such as methane, and nitrous oxide.
| Primary Energy Source | % Total PES | g CO2 e/kWh | Low Price ($/kWh) | High Price ($/kWh) |
| Biofuels & Waste | 9.7% | 18 | $0.06 | $0.11 |
| Coal | 28.1% | 600 - 1001 | $0.06 | $0.14 |
| Oil | 31.7% | 778 | $0.07 | $0.10 |
| Natural Gas | 21.6% | 443 | $0.04 | $0.08 |
| Nuclear | 4.9% | 66 | $0.11 | $0.18 |
| Hydroelectric | 2.5% | 13 | $0.02 | $0.19 |
| Other (Wind, Solar, Geothermal) | 1.5% | 20 | $0.03 | $0.11 |
| Weighted Average (approx.) | 600 | $ 0.06 | $ 0.12 |
Table 8 - World Power Costs & Emissions by Energy Source
*Note: When using Carbon Capture Systems (CCS), CO2 emissions from Coal are reduced substantially.
Although the average rate for US industrial companies is about $0.07/kWh82, a safer assumption for Bitcoin miners would be closer to 3 or 4 cents, for the reasons mentioned above. There are several documented cases of the largest bitcoin mining operations paying $0.04/kWh83, with reports that Bitmain was receiving a $0.02/kWh rate in their Yunnan facility84, and one particular CEO claiming a cost of electricity of only 1.7 cents/kWh for their mining operation in Moses Lake, Washington, USA85 .
Mining Mix – “The Network Average Miner”
There are two types of miners; chip-fabricator miners, and retail miners. Retail miners can be split further into another two categories, large retail miners and small/individual miners. Small individual miners can also forego buying hardware themselves, and instead purchase mining contracts. Due to intellectual property and some economies of scale, chip-fabricators (chipfabs) can mine for significantly cheaper than retail miners. Typical gross profit margins in the semiconductor industry has averaged over 45% for a four-year period86, with the most profitable ones close to 60%. The computer hardware industry averages around 35%87 . Gross profit margins are used since operating expenses and depreciation are dealt with separately within the model. It is assumed that miners pay no tax (i.e. they retain all coins that are mined and/or asset depreciation costs are high enough to offset a large amount of tax on revenue from sold mining hardware). Due to the lack of competition in the ASIC hardware space, margins would likely be 50 to 60%. Obviously, there is a limit to the margin that can be made on mining hardware, as the customer base is quite savvy and can easily calculate profitability of their purchased miners at a particular price-point. For the purposes of this study, it will be assumed that Bitcoin ASIC manufacturers make 60% gross margin on all hardware sold.
Determining the number of non-chipfab large miners and individual miners is another area of speculation due to lack of robust market data. One half-insight can be gained from looking at the world’s largest cloud-mining operation, Genesis Mining, who claim to have 2 million users88 . Despite its MUCH higher price per GH/s (27c/GH (including electricity costs and incidentals)89 vs Bitmain’s 3.7c/GH), it may still be practical for many miners to opt for a cloud-based solution due to its “plug-and-play” nature, and more importantly, that it is an “instant-on” solution, so that you don’t lose your most profitable days waiting for your miner to be shipped to you. That said, Genesis provides no data on their aggregate hash power, nor do they reveal details on the location of their server farms, or even which pools they mine on90 .
Next comes the question of chipfabs mining on their own equipment, and how much equipment has made it out into the market for large-scale and small-scale miners. According to an analysis by Sanford C. Bernstein & Co, it was estimated that Bitmain captured 75% of market share in hardware sales, Canaan Creative captured 15% of the market, and other manufacturers made up the remaining 10%91 . Bitmain’s CEO has stated that the company earned USD$2.5B in revenue for 201792, with the majority of that revenue earned through mining sales, as opposed to mining and selling Bitcoin directly. From this, we can size the market for mining hardware to be a maximum of USD$3.33bn, as some part of Bitmain’s revenue would be mining based. Based on the 2017 average price of an S9 miner of around USD$300093, this means that Bitmain shipped over 800,000 units. If Bitmain’s revenue of $2.5B was a 75% share of the market, then Canaan Creative’s 15% share would translate into an annual revenue of around $0.5B, with the remainder of the market making up the remaining $0.33B.
Canaan sells their Avalon miners in a minimum order quantity of 40 units at a very similar price-point to Bitmain, so it is safe to assume that Canaan services medium-to-large scale miners. Putting the numbers together, it is assumed that Canaan would have shipped over 150,000 Avalon units, with the rest of the market producing 100,000 “equivalent” units. Rounding down, one could draw the conclusion that 1 million S9equivalent mining units were shipped.
At this hash rate and price per S9i, this model estimates that roughly $115 million is invested in more mining power every difficulty cycle (see CAPEX on page 16), or around $3.25 billion per year (in line with 2017 figures). Drawing on the 80/20 rule again we can put chipfabs somewhere in the ballpark of 20% of direct hash power. That said, with Bitmain administering at least two mining pools (AntPool & BTC.com)91 providing 40.2% of hash power62, it is likely that they contribute about half of that power or more. Throw in the other chipfabs in proportion to the sales figures mentioned above, as well as any chipfabs that don’t sell to the public, and we will assume that chipfabs provide at least 35% of direct hash power for this study.
Due to the laws of perfect competition discussed earlier, it can be assumed that only the most profitable miners are switched on at any given time, and that when a new generation of mining equipment is released, equilibrium is reached very quickly where all miners are operating at a similar cost basis.
| Retail Miner | Chip Fabricator | Weighted Average | |
| Hash Power Share % | 65% | 35% | |
| Discount Level | 0% | 60% | |
| $/GH | 0.047 | 0.019 | 0.037 |
| W/GH | 0.098 | 0.098 | 0.098 |
| $/W | 0.04 | 0.02 | 0.033 |
Table 9 - Rationalised Weighted “Network-Average” Miner
Network Hash rate
As at the date of this report, total network hash rate is 42,587,731,568 GH/s. Miners need to successfully forecast hash rate and difficulty increases when planning future capital expenditure and setting strategy and targets.
Environmental Cost Inputs & Drivers
CAPEX
To better assess the overall impact of the bitcoin mining industry, we should also consider the CO2 emissions from the manufacture and recycling of mining equipment.
A study using data from 200094 suggests that total energy to produce a PC is 895kWh. Although the data is quite dated, it sets a very conservative benchmark, as manufacturing efficiencies consistently improve in line with the laws of competition, alongside Moore & Koomey’s laws discussed earlier.
| Direct Fossil (MJ) | Electricity (kWh) | Total Energy (MJ) | Total Energy (kWh) | |
| Semiconductors | 298 | 170 | 909 | 252.5 |
| Semiconductor manufacturing equipment | 392 | 29.4 | 498 | 138.3 |
| Passive Components | 109 | 10.3 | 146 | 40.6 |
| PCB | 26.7 | 7.71 | 54.5 | 15.1 |
| Bulk Materials | - | - | 770 | 213.9 |
| Silicon Wafers | 0 | 38.1 | 137 | 38.1 |
| Assembly | 35.3 | 51.2 | 220 | 61.0 |
| Transport | 338 | 3.5 | 351 | 97.4 |
| Packaging | 120 | 4.8 | 137 | 38.1 |
| 1319 | 315 | 3222 | 895 |
Table 10 - Energy Required for ASIC manufacture
As 98% of electronic waste is completely recyclable95, and an estimated energy saving of 90% on the recovery of metals and silicon96, we will reduce the “Bulk Materials” energy use by 90%, to result in a total of 703 kWh. Recycling of ASICs is a fair assumption due to the short life of mining equipment, and the value to be extracted out of quickly obsolete equipment through means of recycling.
OPEX
Environmental Impact from operations is effectively pure energy use. If miners are using cheap hydroelectricity to mine, emissions are insignificant. If miners are using dirty coal with no carbon capture, environmental impact is much higher.
It is assumed that the average miner will use power that emits a weighted average value of CO2 based on the world’s energy mix shown in Table 8.
Calculating the Costs
Economic Costs
The following tables shows the outputs from the economic model, which is based on the assumptions set out in the section on Economic Cost Inputs / Drivers . Orange cells are variables / inputs, grey cells are calculation cells.
CAPEX
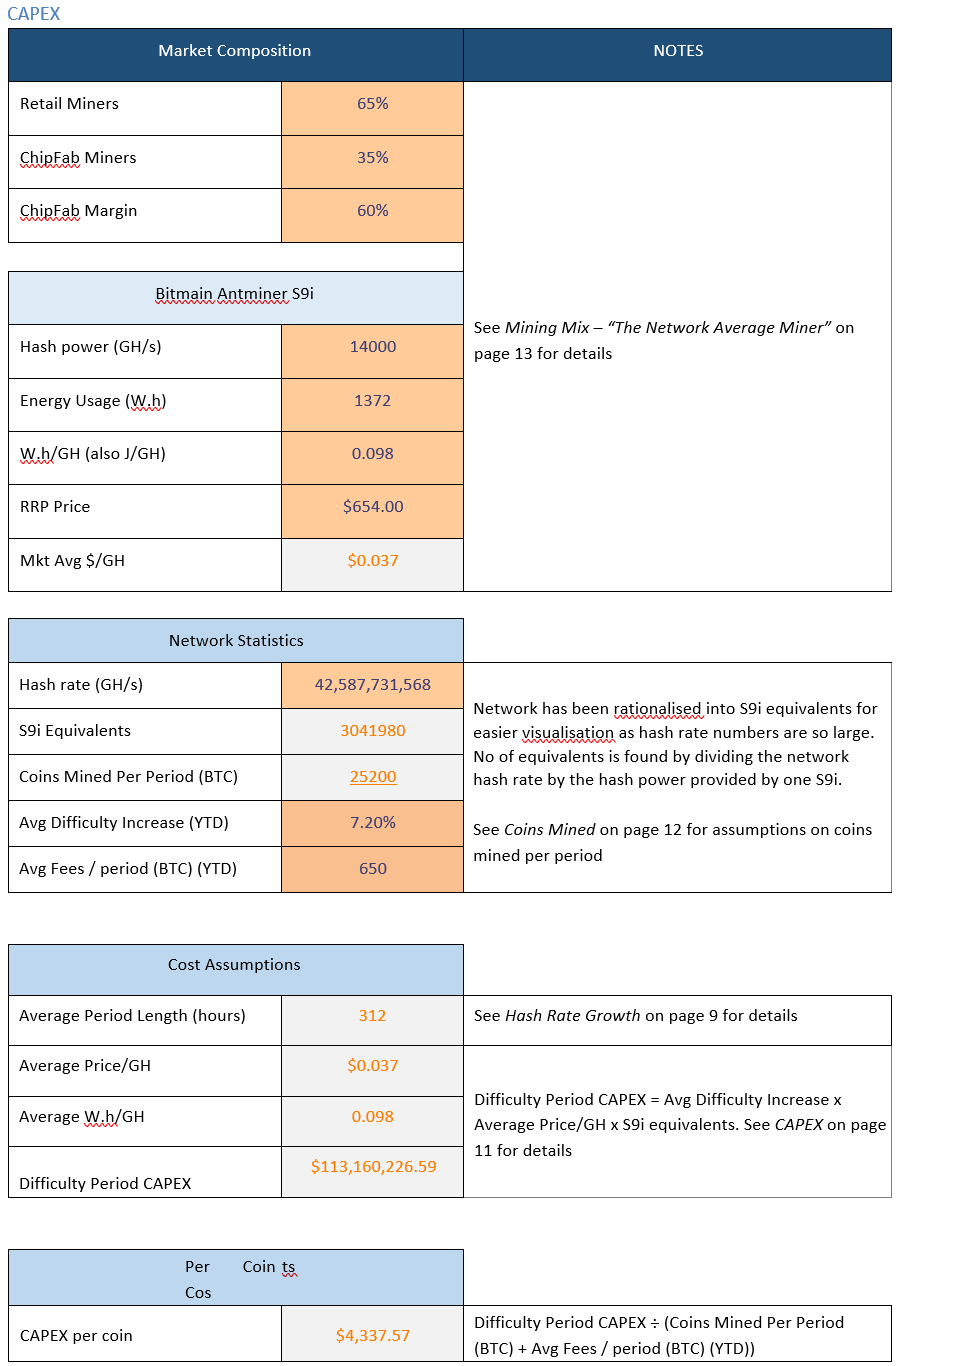 Table 11 - Bitcoin’s Economic Costs - CAPEX
OPEX
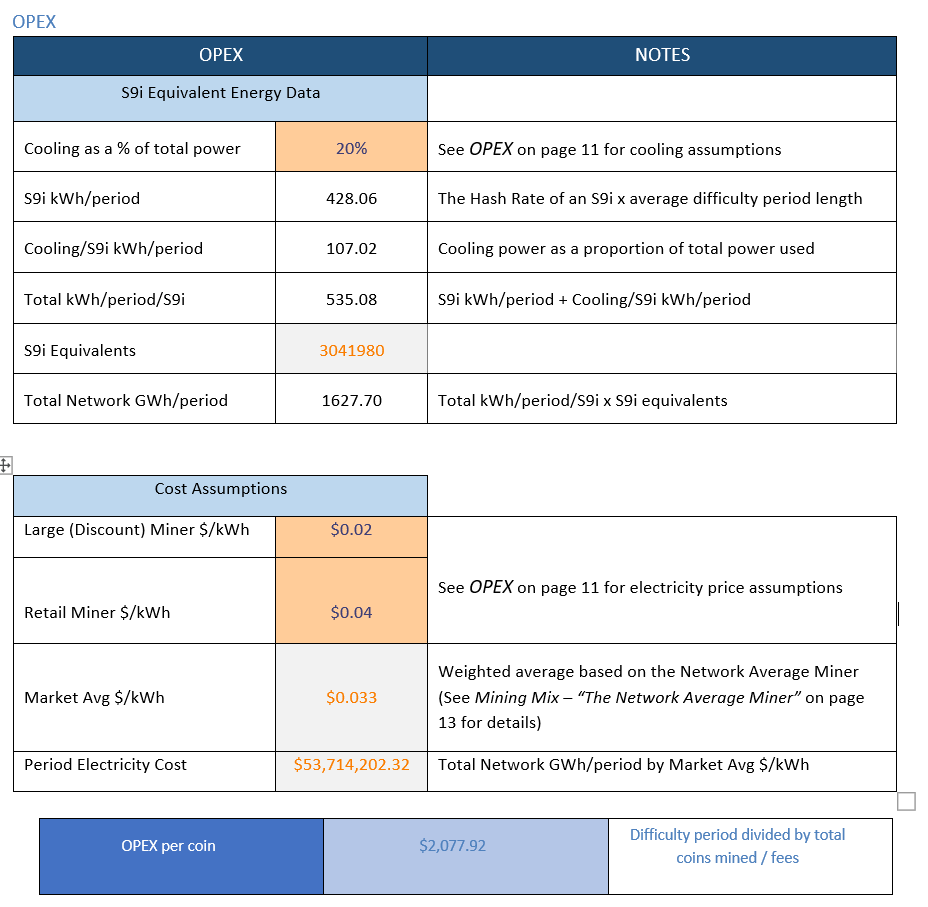 Table 12 - Bitcoin’s Economic Costs - OPEX
Total Cost of a Bitcoin
Adding the CAPEX figure of $4,337.57 to the OPEX figure of $2,077.92 results in a total cost of $6,455.49.
Environmental Costs
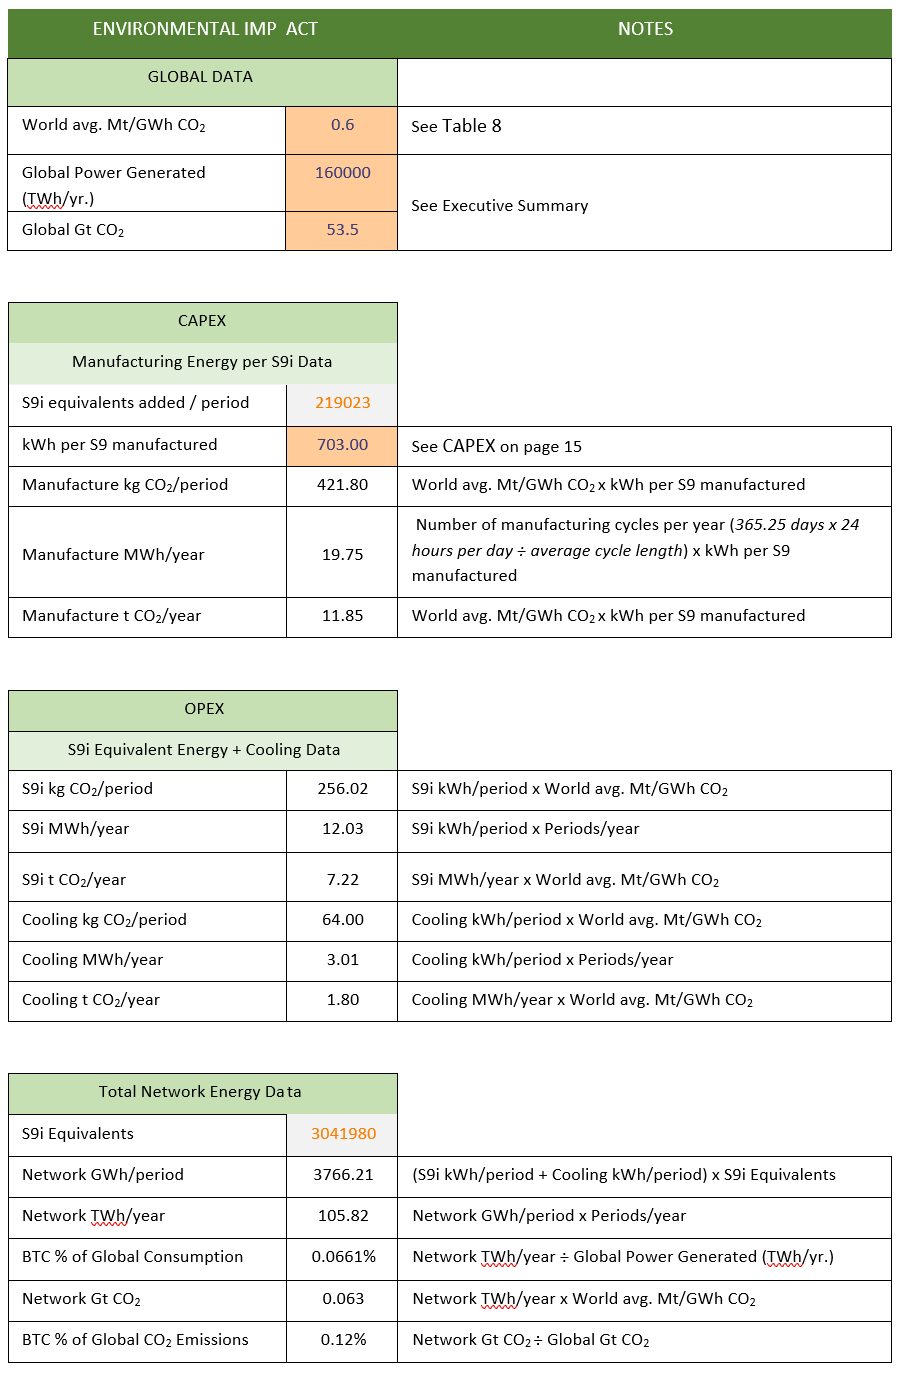 Table 13 - Bitcoin’s Energy Use & Emissions
Environmental Impact Factors
It is unfair to only benchmark Bitcoin’s environmental impact by CO2 emissions alone, so we will assess a few other environmental impacts to compare with the impact of Gold mining.
Eutrophication
Eutrophication, measured in tonnes of Phosphorous equivalents, is the introduction of nutrients into groundwater and other fresh water sources, having a drastic impact on water quality, the local ecology in general, and adverse economic impacts97 . Bitcoin generally has very low externalities, as it relies almost strictly on the electrical grid both to mine and produce hardware. Therefore, to determine the Eutrophication produced by the energy sources that power Bitcoin, based on a weighted world average.
Global Eutrophication stands at 126.6 million tonnes per year98, from a total 150,000 TWh/yr. of global energy produced99, therefore, 1TWh produces about 850 tonnes of PO43- equivalents. As Bitcoin uses around 105TWh/yr., 89,250 tonnes are produced.
Acidification
| Country100 | Acidification (g SO2 eq/kWh) | Energy Mix |
| Turkey | 9.79 | 43.6% Natural Gas, 28.1% Coal, 24.2% Hydro, 4.1% other (71.7% total fossil fuels) |
| Portugal | 1.22 | 22% Coal, 22% Gas, 24% Hydro, 22% Wind, 2% Solar, 6% Biowaste, 2% Oil101 (46% fossil fuels) |
| Spain | 4.93 | 22% Nuclear, 14% Coal, 20% Gas, 6% Oil, 13% Hydro, 18% Wind, 5% Solar, 2% Biofuel101 (40% total fossil fuels) |
| Belgium | 1 | 53% Nuclear, 24% Renewables, 26% Gas, 3% Coal, 0.1% Oil101 (29.1% total fossil fuels) |
| Tanzania | 4.53 | 45% Natural Gas, 42% Hydro, 13% Liquid Fuel102 (58% fossil fuels) |
| Nigeria | 0.22 | 82.2% Biomass & Waste, 10.6% Oil, 6.8% Natural Gas, 0.4% Hydro103 (17.4% fossil fuels) |
| Mexico | 6.59 | 34.45% Natural Gas, 4.89% Coal, 34.83% Oil, 15.75% Gasoline, 7.79% Renewable, 0.78% Nuclear, 1.5% other104 (89.92% Fossil Fuels) |
| Average | 4.04 |
Table 14 - Bitcoin’s Environmental Impact - Acidification
As can be seen from above, countries that have high percentages of Natural Gas in their energy mix contribute greatly to acidification, while Biomass contributes insignificant amounts. Coal & Oil also have large contributions. Since the global energy mix (Table 6) consists of 81.4% fossil fuels (of which 21.6% is Natural Gas), 9.7% Biowaste, and 8.9% Nuclear & Other Renewables, using the average of around 4 g SO2 eq/kWh is appropriate due to the contribution of Biowaste, as well as the above sample countries with high acidification having a disproportionately high use of natural gas compared to the world average. At 78TWh/yr. of energy usage, the Bitcoin Network produces 312,000 tonnes of SO2 equivalents
Ecotoxicity, Carcinogenics, Non-Carcinogenics, and Respiratory Inorganics
Global per-capita data on Ecotoxicity, Carcinogenics, Non-Carcinogenics, and Respiratory Inorganics measures105 are as shown in Table 15. Population statistics106,107,108,109 are also included. All data is as at 2011.
| North America | Europe | Middle East | Eurasia | Asia & Oceania | Africa | Central & South America | |
| Freshwater Ecotoxicity (CTUe) | 2.72E+04 | 1.79E+04 | 3.30E+03 | 1.38E+04 | 5.42E+03 | 1.63E+03 | 1.47E+03 |
| Carcinogenics (CTUh) | 2.67E-04 | 1.48E-04 | 2.36E-05 | 1.28E-04 | 5.20E-05 | 1.70E-05 | 9.54E-06 |
| Non-Carcinogenics (CTUh) | 1.04E-03 | 6.69E-04 | 1.70E-04 | 5.75E-04 | 2.40E-04 | 6.40E-05 | 4.35E-05 |
| Respiratory Inorganics (PM2,5) | 2.66 | 1.26 | 1.29 | 2.46 | 3.72 | 0.199 | 0.443 |
| Population (millions) | 560 | 515 | 145 | 180 | 4,100 | 1,050 | 480 |
Table 15 - Ecotoxicity, Carcinogenics, Non-Carcinogenics, & Respiratory Inorganics Data (per-capita)
When per capita stats are multiplied by population figures, and the totals then divided by world energy generation (~ 150,000 TWh/yr.), then multiplying per 78TWh for energy used on the Bitcoin network, the following is found:
| Freshwater Ecotoxicity (CTUe) | Carcinogenics (CTUh) | Non- Carcinogenics |
| (CTUh) | Respiratory Inorganics (PM2,5) | Population (Billion) | ||||
| Total | 5.21E+13 | 4.88E+05 | 2.13E+06 | 1.85E+10 | 7.04 | |
| Total/TWh | 3.42E+08 | 3.20 | 13.96 | 1.21E+05 | ||
| Bitcoin | 2.66E+10 | 249.73 | 1088.97 | 9.45E+03 |
Table 16 - Bitcoin Ecotoxicity, Non-carcinogenics, Carcinogenics & Respiratory Inorganics
A comparison of these 6 indicators versus that of gold mining and recycling is discussed in the section on
Revisiting Gold on page 22.
Sensitivity Analysis
For the below sensitivity analysis, it is assumed that all aforementioned assumptions in the model are held constant, with one variable being changed at a time to see the impact on overall cost. Four scenarios are demonstrated for each of the 6 variables below, alongside the difference between the modelled cost of $6,455.49.
| Mining Mix* | CAPEX | OPEX | TOTAL | Δ |
| 20/80 Chipfab to Retail | $4,876.28 | $2,266.82 | $7,143.10 | 10.65% |
| 30/70 Chipfab to Retail | $4,543.81 | $2,140.89 | $6,684.69 | 3.55% |
| 40/60 Chipfab to Retail | $4,211.33 | $2,014.95 | $6,226.29 | -3.55% |
| 50/50 Chipfab to Retail | $3,878.86 | $1,889.02 | $5,767.88 | -10.65% |
| Miner’s Margin | CAPEX | OPEX | TOTAL | Δ |
| 30% | $4,959.40 | $2,077.92 | $7,037.32 | 9.01% |
| 40% | $4,765.46 | $2,077.92 | $6,843.38 | 6.01% |
| 50% | $4,571.51 | $2,077.92 | $6,649.43 | 3.00% |
| 70% | $4,183.63 | $2,077.92 | $6,261.55 | -3.00% |
| Electricity Price | CAPEX | OPEX | TOTAL | Δ |
| 1c/2c Chipfab to Retail | $4,377.57 | $1,038.96 | $5,416.53 | -16.09% |
| 1c/3c Chipfab to Retail | $4,377.57 | $1,448.25 | $5,825.82 | -9.75% |
| 2c/5c Chipfab to Retail | $4,377.57 | $2,487.21 | $6,864.78 | 6.34% |
| 3c/5c Chipfab to Retail | $4,377.57 | $2,707.59 | $7,085.16 | 9.75% |
| Cooling Power % | CAPEX | OPEX | TOTAL | Δ |
| 15% | $4,377.57 | $1,955.69 | $6,333.26 | -1.89% |
| 25% | $4,377.57 | $2,216.45 | $6,594.02 | 2.15% |
| 35% | $4,377.57 | $2,557.44 | $6,935.01 | 7.43% |
| 40% | $4,377.57 | $2,770.56 | $7,148.13 | 10.73% |
| Transaction Fees | CAPEX | OPEX | TOTAL | Δ |
| 500 | $4,403.12 | $2,090.05 | $6,493.17 | 0.58% |
| 750 | $4,360.70 | $2,069.91 | $6,430.61 | -0.39% |
| 1250 | $4,278.27 | $2,030.78 | $6,309.05 | -2.27% |
| 1500 | $4,238.21 | $2,011.77 | $6,249.98 | -3.18% |
| Ave Difficulty Change % | CAPEX | OPEX | TOTAL | Δ |
| 5.50% | $3,343.98 | $2,117.88 | $5,461.86 | -15.39% |
| 6.50% | $3,951.97 | $2,097.90 | $6,049.87 | -6.28% |
| 8.50% | $5,167.97 | $2,051.28 | $7,219.25 | 11.83% |
| 9.50% | $5,775.96 | $2,031.30 | $7,807.26 | 20.94% |
-
- a 50/50 ratio should be theoretical maximum, as risk of perception of a 51% attack becomes too high for large miners due to potential catastrophic impact on market price.
Over time, the above sensitivities will allow us to make sense of the model’s results when compared to actual market price and tweak the model in line with new evidence.
Comparative Summary
Revisiting Gold
Since this study has considered the manufacture of ASICs in its evaluation of Bitcoin’s impact, we must now visit the environmental impact of the manufacture of mining equipment to make a like-for-like comparison. To start, we will revisit the subtotal impact of Gold mining considering current production levels. From there, we will add impacts from machinery production to the original tally. Since the previous iteration of this research in 2014 (using 2013 data), World Gold production has increased 18% from 2770 tonnes, to 3270 tonnes in 2017110 . We have also witnessed a sharp drop in the amount of recycled gold produced, going from 37% of total annual production in 2011 produced gold coming from recycled down to only 26% at 1160 tonnes in 2017.
In a very comprehensive study produced by Dell in November 2017111 showed some fascinating information on the relative sustainability of gold mining, and gold recycling. Results are shown in Figure 5 and Figure 6. It should be noted that Dell’s 15 tonne CO2/kg figures for gold mining exclude the construction and demobilisation of mine infrastructure, and site remediation. When including those, the original figure of 20 tonne CO2/kg1 that we used in 2014 was a very fair estimate. Perhaps the best observation to draw from the Dell data is just how toxic and harmful gold mining is to the planet, even though it produces less than half the amount of CO2 per kilo.
Figure 5 - Resource inputs per kilogram of gold recycled
Figure 6 - Environmental comparison of recycling vs mining 1 kilogram of gold
Now that our original assumptions for gold mining have been validated against an in-depth recent study by Dell, we can take a look at how the numbers stacked up in 2017.
| Greenhouse Emissions (t CO2/kg Au) | Energy Consumption (MWh/kg Au) | |
| Rate Per kg - Mining | 20.001 | 48.611 |
| Rate Per kg - Recycling | 37.00111 | 31.32111 |
| Tonnes Produced110 | Greenhouse Emissions (Million t CO2) | Energy Consumption (TWh) | |
| Mined | 3268.7 | 65.374 | 158.9 |
| Recycled | 1160 | 42.92 | 36.34 |
NOTE: All figures have been rationalised into MWh. 1 GJ = 0.27777 MWh. 1 MWh = 3.412 million BTU
Table 17 - Environmental Impact of Gold Mining & Recycling
The next item to assess in the impact of producing mining equipment. To do this, we can look to the world’s largest Gold mining company, Barrick Gold, and the fleet and staff data they provide for their Pueblo Viejo112, Veladero (open-pit)113, and Barrick Nevada (Cortez114, and Goldstrike115 mine operations), which produce 107 tonnes of Gold per year116, or, about 3.3% of total supply. The aggregate of the fleet lists for the above four mines, alongside data on the weight of machinery from manufacturers are shown in Table 19 and Table 18, below. As can be seen, much less machinery is used in an underground environment as opposed to an openpit environment. Fleet data does not include the several hundred regular site-vehicles for staff use on the mine site. With an average of 42 staff per tonne of gold produced at the aforementioned mines, it is assumed that 10% of staff have vehicles for use on site, resulting in an extrapolated figure of around 15,000 site vehicles globally. 11 tonnes of CO2 to produce a vehicle117 means that 165,000 tonnes of CO2 are created. Converting this to a kWh equivalent figure, we divide 0.165 million tonne CO2 by 600 tonnes CO2/TWh (Table 8), resulting in 0.09 TWh equivalent. It is assumed site vehicles will last for 10 years (i.e. 0.009 TWh/year).
| Machine | Make | Qty | Weight (t) | Total Weight (t) |
| R-2000 RoadHeader | Alpine | 1 | 60.00 | 60 |
| 3.5 yd3 Loader | AtlasCopco | 5 | 17.27 | 86 |
| Boltec M Bolter | AtlasCopco | 16 | 21.60 | 346 |
| 120 Grader | Caterpillar | 7 | 16.88 | 118 |
| 414E loader | Caterpillar | 19 | 6.82 | 130 |
| 966 Loader | Caterpillar | 4 | 16.74 | 67 |
| AD30 Truck | Caterpillar | 11 | 30.00 | 330 |
| D4 Dozer | Caterpillar | 12 | 4.93 | 54 |
| R1600G loader | Caterpillar | 14 | 29.80 | 268 |
| DT-20N truck | DUX | 2 | 19.40 | 39 |
| DT-26N truck | DUX | 13 | 25.00 | 325 |
| A64-C/LT/SL Vehicles | Getman | 21 | 12.50 | 75 |
| Mule Pro-DXT Utility Vehicle | Kawasaki | 62 | 0.84 | 52 |
| MHT Telehandler | Manitou | 4 | 24.00 | 96 |
| Rough-Terrain Forklifts (various) | Manitou | 23 | 5.00 | 115 |
| Ultimec MF500 Shotcreter | Normet | 7 | 12.00 | 84 |
| DT721 Tunnelling Jumbo | Sandvik | 11 | 24.50 | 270 |
| Tamrock 1400 Hauler | Sandvik | 8 | 33.70 | 270 |
| Total Weight | 2784 |
Table 18 - Underground Fleet Register for Barrick’s Nevada Mines (Cortex & Goldstrike)
| Machine | Make | Weight | Qty | Total Weight (t) |
| (t) | ||||
| L2350 loader | Komatsu | 72.57 | 2 | 145 |
| Haul Truck, 730E | Komatsu | 146.69 | 19 | 2787 |
| Face Shovel, PC4000 | Komatsu | 362 | 2 | 724 |
| Wheel Loader, WA1200 | Komatsu | 216.4 | 3 | 649 |
| Track Dozer, D375A | Komatsu | 56.29 | 6 | 338 |
| Track Dozer, D85-EX | Komatsu | 28.1 | 1 | 28 |
| Motor Grader, GD825A | Komatsu | 29.68 | 3 | 89 |
| Backhoe, PC300LC | Komatsu | 33.8 | 1 | 34 |
| Backhoe, WB140 | Komatsu | 7.3 | 1 | 7 |
| Wheel Dozer, WD500 | Komatsu | 26.9 | 1 | 27 |
| Wheel Dozer, WD600 | Komatsu | 41.08 | 2 | 82 |
| Water Truck, 330M | Komatsu | 24.04 | 2 | 48 |
| 930E Truck (290t) | Komatsu | 210.19 | 24 | 5044 |
| HM400 Water Truck | Komatsu | 30.3 | 3 | 91 |
| 605 Truck (water) | Komatsu | 46.2 | 6 | 277 |
| 930E Water Truck | Komatsu | 505.75 | 3 | 1517 |
| Face Shovel, PC5500 | Komatsu | 490 | 2 | 980 |
| Backhoe, PC2000 | Komatsu | 204.12 | 1 | 204 |
| P&H 4100 XPB shovel | Komatsu | 1512 | 7 | 10584 |
| P&H 2800 XPB shovel | Komatsu | 1084 | 4 | 4336 |
| Liebherr T282B trucks | Liebherr | 252 | 25 | 6300 |
| Face Shovel, 996 | Liebherr | 676 | 3 | 2028 |
| Drill, SKS 12 | Reedrill | 95.58 | 2 | 191 |
| DrillTech D55SP | Sandvik | 79.33 | 12 | 952 |
| DrillTech D75K | Sandvik | 64.86 | 11 | 714 |
| Drill (Blasthole), D90K | Sandvik | 140.33 | 5 | 702 |
| Sandvik D45KS Drill | Sandvik | 47.73 | 2 | 95 |
| Sandvik DX780 Drill | Sandvik | 14.8 | 2 | 30 |
| Drill, Ranger 700 | Sandvik | 15.2 | 1 | 15 |
| DP 1500 | Sandvik | 19.2 | 2 | 38 |
| Schramm T450GT Drill | Schramm | 21.75 | 1 | 22 |
| PV271 drill | AtlasCopco | 84 | 8 | 672 |
| Flexirock D65 drill | AtlasCopco | 24 | 3 | 72 |
| MD6420 drill | Caterpillar | 95 | 1 | 95 |
| 795F trucks (345 st) | Caterpillar | 202.27 | 30 | 6068 |
| 16H grader | Caterpillar | 24.7 | 16 | 395 |
| 24H grader1 | Caterpillar | 73.34 | 7 | 513 |
| 994F Front-End Loader | Caterpillar | 243.11 | 7 | 1702 |
| D10T Track Dozer | Caterpillar | 70.17 | 20 | 1403 |
| D9T Track Dozer | Caterpillar | 48.99 | 3 | 147 |
| 834H Wheel Dozer | Caterpillar | 47.11 | 7 | 330 |
| 854K Wheel Dozer | Caterpillar | 98.49 | 7 | 689 |
| 777F Haul Truck | Caterpillar | 80 | 13 | 1040 |
| C322 Hydraulic Excavator | Caterpillar | 24.83 | 1 | 25 |
| C336 Hydraulic Excavator | Caterpillar | 30.5 | 3 | 91 |
| 349D Hydraulic Excavator | Caterpillar | 45.83 | 1 | 46 |
| 962 Support Loader | Caterpillar | 19.37 | 2 | 39 |
| 938 Support Loader | Caterpillar | 13.18 | 1 | 13 |
| 785C Haul Truck | Caterpillar | 102.15 | 6 | 613 |
| 6040 Trackhoe | Caterpillar | 397.4 | 1 | 397 |
| 992 Loader | Caterpillar | 94.93 | 5 | 475 |
| 793 Haul Truck | Caterpillar | 122.3 | 46 | 5626 |
| 385 Backhoe | Caterpillar | 84.13 | 1 | 84 |
| 345 Backhoe | Caterpillar | 45.38 | 1 | 45 |
| 988 Wheel Loader | Caterpillar | 43.37 | 4 | 173 |
| 789C / 789D Haul Truck | Caterpillar | 99.12 | 34 | 3370 |
| EX-5500 excavator | HItachi | 518 | 4 | 2072 |
| EX3600 Hydraulic Shovel | Hitachi | 362 | 2 | 724 |
| X1200 Hydraulic Excavator | Hitachi | 112 | 1 | 112 |
| Drill, DMM2 | Ingersoll Rand | 5.4 | 3 | 16 |
Total Weight (tonnes): 66128
Table 19 - Open-pit Fleet Register for Barrick’s Nevada, Pueblo Viejo and Veladero Mines
August 2018 Edition 25
Having precise data on the machinery required to produce 3.3% of the world’s Gold, we will extrapolate the total weights found above (66128 + 2784 = 68,912 tonnes) out to the other 96.7% of the market. This results in almost 2.1 million tonnes of mining equipment, which we will conservatively assume is mostly steel for the next part of the analysis (since the energy needed to extract steel is typically lower than other materials used in vehicles, such as aluminium)118 .
1.95 tonnes of CO2 are emitted in the extraction and production of one tonne of steel119 . Data on vehicle manufacturing shows that the manufacture and transport stages of the vehicles life can vary anywhere from 5 to 20% of the energy required to extract raw materials118 . Therefore, we will say that for each tonne of manufactured and delivered construction machinery there is 2.2 tonnes of CO2 emitted (i.e. 1.95 tonnes + 10%). Multiplying this by 2.1 million tonnes of global Gold mining equipment results in 4.62 million tonnes of CO2 . We will also conservatively say that well maintained mining machinery will last for 10 years if operated 24 hours per day, 365 days per week, resulting in a yearly average emission of 0.462 million tonnes of CO2, or 0.77 TWh equivalent., towards the manufacture of new machinery.
This 210,000-tonne heap of equipment also needs to be packaged and transported each year. While there is no data on emissions from packaging an excavator, estimations can be made regarding transportation emissions. As most mines are remote, equipment must be transported using several modes – by sea to move equipment continentally and then by road. A 3000-kilometre journey is not something unusual and would even be considered very conservative considering where the major equipment manufacturers are based, and how remote these mines truly are. We will assume that 75% of the journey happens via sea freight, and 25% of the journey via truck transport. This results in 4.725 billion tonne-km by sea, and 1.575 billion tonne-km by road. With sea travel on a large container barge producing 19.6 g/CO2 per tonne-kilometre, and 62 grams for road travel120, this results in 190,000 tonnes of CO2, or 0.114 TWh equivalent.
Therefore, the total amount of energy needed to manufacture and deliver machinery to the mines is 0.77 TWh for manufacture of machinery, 0.009 TWh for site vehicles, 0.0114 TWh for transport, which equals 0.7904 TWh, or, 0.474 million tonnes of CO2 . Adding this to mining and recycling totals shown in Table 17, we have the following:
| Tonnes Produced110 | Greenhouse Emissions (Million t CO2) | Energy Consumption (TWh) | |
| Mined | 3,268.7 | 65.374 | 158.9 |
| Recycled | 1,160 | 42.92 | 36.34 |
| Equipment | 2,100,000 | 0.474 | 0.7904 |
| Total | 108.768 | 196.09 |
Table 20 - Gold’s Environmental Impact - Energy Use & Emissions
Comparison of Yearly Energy Use
Looking at the table below, it appears that Bitcoin uses a substantial amount of energy – now closing in on the entire Gold industry, and due to its reliance on the electrical grid, CO2 emissions are high. As the electric grid moves towards renewable energy sources, Bitcoin’s figures for CO2 emissions will continue to improve, however there will be little improvement in the gold mining industry. That said, Bitcoin’s energy use will continue to grow in line with the Network’s computing power growth, and will most likely eclipse the Gold Industry within this decade.
Another interesting statistic is that more energy goes into building Bitcoin hardware than goes to producing the world’s gold mining equipment. But since a large part of ASIC manufacture is tied to the electrical grid (Table 10), Bitcoin’s emissions proportional to its energy use will reduce
| Energy Used (kWh) | Tonnes CO2 Produced | Emission-Per-Unit Trend | |
| Gold Mining + Equipment | 159.69 million | 65.85 million | Increasing |
| Gold Recycling | 36.34 million | 42.92 million | Decreasing |
| Bitcoin Mining | 105.82 million | 63 million | Decreasing |
Table 21 - Bitcoin vs. Gold - Emissions & Energy Use
Comparison of Other Environmental Indicators
As can be seen below, Bitcoin is dramatically less harmful than Gold on all indicators aside from Carcinogenics, where the Global Electric Grid, i.e., the sole unified entity powering the Bitcoin network, spews more than double that of the Gold industry. As the electric grid moves towards renewable energy sources, Bitcoin’s figures will continue to improve quite dramatically, however there will be little improvement in the gold mining industry.
| Gold Mining | Gold Recycling | Total Gold (tonnes) | Bitcoin | Δ | |
| kg Produced | 3268700 | 1160000 | 4428.7 | ||
| Acidification (kg SO2 /kg) | 175 | 180 | 780823 | 423265 | -45.8% |
| Eutrophication (kg PO43- /kg) | 4095 | 175 | 13588327 | 89944 | -99.3% |
| Freshwater Ecotoxicity (CTUe/kg) | 22139602 | 154278 | 7.25E+10 | 3.61E+10 | -50.2% |
| Carcinogenics (CTUh/kg Au) | 0.03208 | 0.00171 | 107 | 339 | 217.1% |
| Non-Carcinogenics (CTUh/kg) | 0.93 | 0.01 | 3051 | 1477 | -51.6% |
| Respiratory Inorganics (PM2,5/kg) | 20 | 12 | 79294 | 12817 | -83.8% |
Table 22 - Bitcoin vs. Gold - Broad Environmental Impact
Discussion & Conclusion
There is no doubt that the Bitcoin Network uses large amounts of energy (yes, it uses more power than the country of Ireland121), however, as alluded to in the Foreword, this energy is necessarily required to effectively turn electricity or power into “money”. While emissions are high, this is due to the composition of the world’s energy grid, and over time, emissions will continue to reduce proportionately to the amount of power that has been used.
Some critics have labelled Bitcoin as an environmental disaster121, however it has been demonstrated that Bitcoin is dramatically less harmful to the environment than the gold mining industry when other key environmental indicators are assessed. Others have made the very fair criticism that costs per transaction are unruly122, especially when volume of transactions (about 7 per second123) is considered in the context of the total power being used by the network. This criticism is only temporarily fair, as the Lightning Network124, which has been live and growing since March 2018, will significantly increase transaction capacity without increasing energy consumption. The Lightning Network, as of July 31, 2018, has over 2700 nodes, 7700 channels, and a network capacity of about 93 BTC125 (note, this is growth of almost 10% in node count, almost 30% in channel count, and over 30% in BTC capacity a period of only two weeks). In fortnight before that (July 1 to July 14), node-count increased over 10%, channel count by 30%, and network capacity more than tripling. It may not be unrealistic to expect a Bitcoin / Lightning Network that can process several hundred near-feeless transactions per second by the end of 2019, and potentially several thousand by the end of 2020. This would effectively allow Bitcoin to scale its transactional capacity by several orders of magnitude ahead of the next price hype-cycle.
As Bitcoin’s market capitalisation grows, let’s say two orders of magnitude to bring it in line with Gold’s $7 trillion-dollar market cap, the Bitcoin mining industry will start to drive innovation in the world’s electrical generation market due to the sheer amount of energy that the network will demand. Judging by current profits that mining hardware manufacturers currently make, mining companies may even become large enough to vertically integrate and acquire energy companies, and to remain competitive, the energy will need to be very cheap which means a high likelihood of migrating to hydroelectricity, and other renewables that get cheaper by the kWh every year.
We have also presented some broad assumptions about the composition of the Bitcoin mining market, and the dynamics at play that affect the cost to mine a coin. As the industry grows by a magnitude or two and becomes more competitive, the market price of a bitcoin will start becoming more correlated with the cost to mine, just as is the case for traditional commodity producers.
References
- McCook, H. 2015, “An Order-of-Magnitude Estimate of the Relative Sustainability of the Bitcoin Network”https://www.academia.edu/7666373/An_Order - of -Magnitude_Estimate_of_the_Relative_Sustainability_of_the_Bitcoin_Network_ - 3rd Edition
- The World Bank, “Total greenhouse gas emissions (kt of CO2 equivalent)”,https://data.worldbank.org/indicator/EN.ATM.GHGT.KT.CE?view=chart , (accessed 21 July 2017).
- Janssens-Maenhout, G. et al, 2017, “JRC Science for Policy Report”http://edgar.jrc.ec.europa.eu/booklet2017/CO2_and_GHG_emissions_of_all_world_countries_booklet_online.pdf (accessed 21 June 2018)
- Kilvert, N., 2017, “Paris agreement slipping away as record global CO2 emissions predicted for 2017”,http://archive.li/zpYnW
- International Energy Agency, 2017, “Key World Energy Statistics”,http://archive.is/PFlG3
- Shapiro, C., Varian, H. (1999) “Information Rules – a strategic guide to the network economy” Boston, Harvard Business School Press 184
- Scholte, J. “Global Capitalism and the State”, _International Affairs_3 427-452 (1997) doi: 10.2307/2624266
- Stiglitz, J (2006) “The Price of Inequality”, New York, W.W. Norton & Company 157-170 (accessed 26 February 2016) http://resistir.info/livros/stiglitz_the_price_of_inequality.pdf (21:24)
- Stiglitz, J. (2010) “Freefall – America, Free Markets, and the Sinking of the World Economy”, New York, W. W. Norton & Company 74-86
- Schumpeter, J A. (2003) [1943] “Capitalism, Socialism and Democracy”, London, Routledge 83
- Nakamoto, S. “Bitcoin: A Peer-to-Peer Electronic Cash System.” No Publisher (2008) https://bitcoin.org/bitcoin.pdf , 19
- McKinsey & Co (2015) “Global Payments 2015: A Healthy Industry Confronts Disruption” (accessed 26 February 2016) http://www.mckinsey.com/~/media/McKinsey/dotcom/client_service/Financial%20Services/Latest%20thinking/Payme nts/Global_payments_2015_A_healthy_industry_confronts_disruption.ashx (22:44)
- Utterback, J. M. (1994) “Managing the Dynamics of Innovation. 1st edition” Cambridge: Harvard Business School Press 145-166
- Berners-Lee, T. “Long Live the Web”, Scientific American 303 80-85 (2010) doi: 10.1038/scientificamerican1210-80
- Müller, R., Kiji, B., Martens, J. “A Comparison of Inter-Organizational Business Models of Mobile App Stores: There is more than Open vs. Closed”, Journal of theoretical and applied electronic commerce research 2 63-76 (2011) doi:10.4067/50718-18762011000200007
- Lerner, J., Tirole, J. “The open source movement: Key research questions”, _European Economic Review_4-6 819826 (2001) doi: 10.1016/S0014-2921(01)00124-6
- Bitcoin Wiki, “Difficulty”, (accessed 27 February) (accessed 27 February 2016) https://en.bitcoin.it/wiki/Difficulty (21:33)
- Bitcoin Wiki, “Controlled Supply”, (accessed 27 February) https://en.bitcoin.it/wiki/Controlled_supply (21:33)
- Hines, J., Rice, E. “Fiscal Paradise: Foreign Tax Havens and American Business”, _The Quarterly Journal of Economics_1 149-182 (1994) doi: 10.2307/2118431
- United Nations (2009), “Human Development Report 2009 – Overcoming barriers: Human mobility and development”, New York, UNDP 2-3
- Plamer, D. (2015) “11 Bitcoin Startups That Went Bust in 2015”, (accessed 26 February 2016) http://www.coindesk.com/bitcoin - startup - shut - down - 2015/ (20:25)
- Parker, L. (2015) “36 bitcoin exchanges that are no longer with us”, (accessed 26 February 2016) http://bravenewcoin.com/news/36 - bitcoin - exchanges - that - are - no - longer - with - us/ (20:26)
- Perez, Y. (2015) “Mt Gox: The History of a Failed Bitcoin Exchange” (accessed 26 February 2016) http://www.coindesk.com/mt - gox - the - history - of - a - failed - bitcoin - exchange/ (20:27)
- Greenberg, A. (2013) “End of The Silk Road: FBI Says It’s Busted The Web’s Biggest Anonymous Drug Black Market”, Forbes, (accessed 26 February 2016) http://www.forbes.com/sites/andygreenberg/2013/10/02/end - of - the - silk - road fbi - busts - the - webs - biggest - anonymous - drug - black - market/#103e7805347d (20:28)
- Urquhart, J. (2014), “Russian authorities say Bitcoin illegal”, Reuters, (accessed 26 February 2016) http://www.reuters.com/article/us - russia - bitcoin - idUSBREA1806620140209 (20:29)
- US Marshalls Service (2015), “USMS Asset Forfeiture Sale”, (accessed 26 February 2016) http://www.usmarshals.gov/assets/2015/dpr - bitcoins/ (20:30)
- Higgins, S. (2015), “SEC Charges GAW Miners CEO Josh Garza With Securities Fraud”, (accessed 26 February 2016) http://www.coindesk.com/gaw - faces - ponzi - scheme - charges - from - sec/ (20:31)
- Rizzo, P (2016), “Making Sense of Bitcoin’s Divisive Block Size Debate” (accessed 26 February 2016) http://www.coindesk.com/making - sense - block - size - debate - bitcoin/ (20:32)
- Hajdarbegovic, N. (2014) “Bitcoin Miners Ditch GHash.io Pool Over Fears of 51% Attack” (accessed 26 February 2016) http://www.coindesk.com/bitcoin - miners - ditch - ghash - io - pool - 51 - attack/ (20:33)
- Pseudonymous (Bitcoin Brother), Pseudonymous (sapiophile) (2015) “Bitcoin Price Chart with Historic Events”(accessed 26 February 2016) https://bitcoinhelp.net/know/more/price - chart - history (20:34)
- Nassim Taleb, N., 2012, “Anti-fragile: Things that gain from disorder”, New York, Random House
- info, Bitcoin Market Price (USD), (accessed 26 February 2016) https://blockchain.info/charts/market price?timespan=all&showDataPoints=false&daysAverageString=1&show_header=true&scale=0&address = (20:35)
- info, “Blockchain charts - Various bitcoin charts and currency statistics” (accessed 26 February 2016) https://blockchain.info/charts (20:36)
- Parkin, M. (2014) “Microeconomics – 11th Edition”, New York: Pearson 272-296
- Mankiw, N. (2011) “Principles of Economics – 6th Edition”: South-Western Cengage 291- 314
- Makowski, L., Ostroy, J. “Perfect Competition and the Creativity of the Market”, Journal of Economic Literature, Vol.XXXIX (June 2001) 479-535
- Stiglitz, Joseph E.;Walsh, Carl E. (2006). “Economics (4th ed.)”, New York: W.W. Norton & Company 205-222
- Dean, J. (1951) “Managerial Economics” New York: Prentice Hall
- Semulson, W., Marks, J. (2012) “Managerial Economics 7th edition”, New York: John Wiley & Sons 283-318
- Bitcoin Wiki, “Transaction Fees”, (accessed 27 February) https://en.bitcoin.it/wiki/Transaction_fees (21:33)
- Wile, R. (14 June 2014) “Today, Bitcoin’s Doomsday Scenario Arrived” (accessed 26 February 2016),http://www.businessinsider.com.au/today - bitcoins - doomsday - scenario - arrived - 2014 - 6?r=US&IR=T ,(21:37)
- Pagliery, J. (2015) “Record $1 billion invested in Bitcoin firms so far”, (accessed 26 February 2016) http://money.cnn.com/2015/11/02/technology/bitcoin - 1 - billion - invested/ (21:38)
- Geroski, P. “The Evolution of New Markets”, Oxford University Press Scholarship Online, 61-100 (2003) doi:10.1093/0199248893
- Washbourne, M. “Diversified Miners Are Best Bet”, Australia’s Paydirt, 1.217 40 (2014)
- Guez, G. “Just 8 percent of Americans are invested in cryptocurrencies, survey says”http://archive.is/Mmvqh
- US Census Bureau, Quick Facts (Accessed 11 June 2018),https://www.census.gov/quickfacts/fact/table/US/PST045217
- Hahm, M. “16.3 million Americans buy and sell bitcoin frequently” (accessed https://finance.yahoo.com/news/16 - 3 million - americans - buy - sell - bitcoin - frequently - html
- Coinbase, About Page (accessed 11 June 2018) http://archive.is/3xPpy
- Statista, “Share of consumers using cryptocurrency as a payment method every day in Europe as of 2016, by country”,http://archive.li/czwvf
- net, “World Population Pyramids”,http://archive.li/Bq9va
- Hileman, G., Rauchs, M. “Global Cryptocurrency Benchmarking Study”, Centre for Alternative Finance, University of Cambridge, pp 10,http://archive.is/eKjmR
- BitcoinRichlist, “Top 100 Richest Wallet Balances (Dec 2014)”http://archive.is/yECCV
- BitcoinRichlist, “Top 100 Richest Bitcoin Addresses” (June 2018),http://archive.is/Fx3K0
- Bansal, D. “Bitcoin Data Science (Pt. 1): HODL Waves”http://archive.is/l7atC
- Fraunhoffer Institute (2013) “Levelized Cost of Electricity – Renewable Energy Technologies” (accessed 26 February 2016)http://archive.fo/0KPll
- Ellerman, A., Convery, F., de Perthuis, C. (2010) “Pricing Carbon – The European Union Emissions Trading Scheme”, Cambridge, Cambridge University Press 85-122
- Afuah, A. (1998) “Innovation Management: Strategies, Implementation and Profits - 1st edition” Oxford: Oxford University Press. 13-46
- Johnson, G., Scholes, K., Whittington, R. (2008) “Exploring Strategy- 8th Edition”, Essex: Pearson 59-6759 Henderson, B. (1976) “The Rule of Three and Four”, s.l.: Boston Consulting Group.
- Sheth, J. N., Sisodia, R. S. (2002) “Competitive Markets and the Rule of Three”, London, Ontario, Canada: Ivey School of Business.
- Pareto, V. (2014) “Manual of Political Economy”, Oxford: Oxford University Press62 Blockchain.info, “Bitcoin Hash rate Distribution”, http://archive.fo/jPsCb
- Deaton, A., Laroque, G. “Competitive Storage and Commodity Price Dynamics”, _Journal of Political Economy_5 896-923 (1996)
- Kilian, L. (2006) “Not All Oil Price Shocks are Alike: Disentangling Demand and Supply Shocks in Crude Oil Markets” CERN Discussion Paper No. 5994 1-57
- Mackey, M. “Commodity price fluctuations: Price dependent delays and nonlinearities as explanatory factors”, _Journal of Economic Theory_2 497-509 (1989) doi: 10.1016/0022-0531(89)90039-2
- Colangelo, G. “Vertical vs. Horiztonal Integration: Pre-emptive Merging”, _The Journal of Industrial Economics_3 323-327 (1995) doi: 10.2307/2950583
- Bitmain “Antminer S9i-14TH/s”,https://shop.bitmain.com/?lang=en ,(accessed 31 July 2018)
- Canaan Creative, 2018, “Avalon 8 Series (Qty 40)- Shipping now Best value”http://archive.is/SkBgK
- info, 2018, “Hashrate”,https://blockchain.info/charts/hash - rate (accessed 14 June 2016)
- Hruska, J., 2013. “ Intel’s former chief architect: Moore’s law will be dead within a decade” http://archive.is/9WNf8
- Koomey, J. et al., 2010. Implications of Historical Trends in the Electrical Efficiency of Computing. _IEEE - Annals of the History of Computing,_33(3), pp. 46-54.
- Johnson, P., Marker, T., 2009, “Data Centre Energy Efficiency Product Profile”,http://archive.li/ng9MO
- Song, Z., Zhang, X., Eriksson, C., 2015. “Data Center Energy and Cost Saving Evaluation”http://archive.is/sEH60
- Ni, J., Bai, X., 2016, “A review of air conditioning energy performance in data centers”, Renewable and Sustainable Energy Reviews, Volume 67 https://www.researchgate.net/publication/308343722_A_review_of_air_conditioning_energy_performance_in_data_c enters ( accessed 22 June 2018)
- ABC News, 2018, “Iceland will soon use more energy mining bitcoins than powering its homes”,http://archive.is/qW31p
- Malkin, S., 2018, “The Cheapest (and Best) Places for Bitcoin Mining”,https://cryptocurrencynews.com/daily news/mining/cheapest - places - mining - bitcoin/ (accessed 22 June 2018)
- info,2018, “Total Transaction Fees”,http://archive.is/ct1ZY
- International Energy Agency, 2017. “Key World Energy Statistics”http://archive.is/gYYIw
- Sovacool, B. K., 2008. “Valuing the greenhouse gas emissions from nuclear power: A critical survey.” _Economic Policy,_Volume 36, p. 2950. http://archive.is/EaI5W
- Moomaw, W. et al., 2011. Annex II: Methodology. In IPCC: Special Report on Renewable Energy Sources and Climate Change Mitigation, Geneva: IPCC.
- Lazard, 2017. “Levelized Cost of Energy 2017”http://archive.is/UwOJA
- Asciento, R. & Lawrence, A., 2013. Will energy prices power US datacenter growth or short-circuit energy efficiency? http://archive.is/RFrKU
- Meyer, D. 2018, “Mining a Bitcoin Costs About as Much as Buying One These Days”http://archive.is/flVWv
- Huang, Z. 2018, “This could be the beginning of the end of China’s dominance in bitcoin mining”http://archive.is/DWBla
- Clenfield, J. & Alpeyev, P., 2014. “The Other Bitcoin Power Struggle”http://archive.li/n8qT2
- com, 2018, “Semiconductors Industry Profitability”,http://archive.is/M0XV8
- com, 2018, “Computer Hardware Industry Profitability”,http://archive.is/eqTiw
- Genesis Mining, 2018, “Homepage”,https://www.genesis - com/ (accessed 14 June 2018)
- Genesis Mining, 2018, “Pricing”,https://www.genesis - com/pricing (accessed 14 June 2018)
- Genesis Mining, 2018, “Customer Service”,https://www.genesis - com/customer - service (accessed 14 June 2018)
- Malwa, S. 2018, “Bitmain Considers Billion Dollar IPO after Expansion in Other Sectors”http://archive.li/IzFkq
- Schmidt, B. 2018, “Crypto’s 32-Year-Old Billionaire Mining King Is Mulling an IPO”https://archive.li/v5uXk
- Cheng, E. 2018, “Secretive Chinese bitcoin mining company may have made as much money as Nvidia last year”http://archive.is/mm1qg
- Williams, “Energy intensity of computer manufacturing: hybrid assessment combining process and economic inputoutput methods,” Environ Sci and Technol, vol. 38, 2004, pp. 6166-6174.
- Australian Bureau of Statistics, 2013, “Waste Account, Australia, Experimental Estimates, 2013 – Electronic and Electrical Waste”,http://archive.is/EZHST
- Zhang, K., Schnoor, J., Zeng, E., 2012, “E-Waste Recycling: Where Does it Go from Here?”, Environment, Science, Technology, Vol 46, pp 10861-10867,http://cedar - ca/pdf/E - Waste_Recyling.pdf (accessed 20 June 2018)
- Smith, V., 2003, “Eutrophication of Freshwater and Coastal Marine Ecosystems: A Global Problem”, Environmental Science & Pollution Research, Volume 10, Issue 2, pp 126-139, https://pdfs.semanticscholar.org/057e/8da9c04b59091046e1482828760472713e30.pdf
- World Resources Institute, 2009, “Sources of Eutrophication (Table 2)”,http://archive.is/9vbx6
- International Energy Agency, 2012, “Key World Energy Statistics”,http://archive.is/Wxlr5
- Günkaya, Zerrin & Özdemir, Alp & Özkan, Aysun & Banar, Müfide. (2016). “Environmental Performance of Electricity Generation Based on Resources: A Life Cycle Assessment Case Study in Turkey”. Sustainability. 8. 1097.10.3390/su8111097. http://www.mdpi.com/2071 - 1050/8/11/1097/pdf
- International Energy Agency, “Member Countries”,http://archive.is/ArM1y
- com, “Tanzania Energy Profile”,https://www.tanzaniainvest.com/energy (accessed 6 July 2018)
- Energypedia, “Nigeria Energy Situation”,http://archive.is/z2lCF
- Energypedia, “Mexico Energy Situation”,http://archive.fo/PGgM4
- Laurent, A., Espinosa, N., 2015, “Environmental impacts of electricity generation at global, regional and national scales in 1980-2011: What can we learn for future energy planning?”http://www.rsc.org/suppdata/ee/c4/c4ee03832k/c4ee03832k1.pdf
- Population Reference Bureau, 2011, “2011 World Population Data Sheet”https://assets.prb.org/pdf11/2011population - data - pdf
- Worldometers, 2018, “World population by Year”,http://archive.fo/ACK7O
- OECD, 2013, “OECD Eurasia Competitiveness Programme”,http://www.oecd.org/global relations/Eurasia%20brochureweb.pdf
- Eurostat, 2011, “2011 Census”,http://archive.fo/wTjW1
- World Gold Council, 2013 - 2018, “Gold Demand Trends”,http://archive.li/ioBTj
- Dell, 2017 “Environmental Net Benefit of Gold Recycling”http://archive.is/UgzhS
- Barrick Gold Corporation, 2018 “Technical Report on the Pueblo Viejo Mine, Sanchez Ramirez Province, Dominican Republic”, pp 16-18 (Table 16-9)
- Barrick Gold Corporation, 2018 “Technical Report on the Veladero Mine, San Juan Province, Argentina”, pp 16-23 (Table 16-11)
- Barrick Gold Corporation, 2016 “Technical Report on the Cortez Joint Venture Operations, Lander and Eureka Counties, State of Nevada, U.S.A”, pp 16-14 (Table 16-6)
- Barrick Gold Corporation, 2017 “Technical Report on the Goldstrike Mine, Eureka and Elko Counties, State of Nevada, U.S.A”, pp 16-5 (Table 16-2), pp 16-13 (Table 16-8)
- Barrick Gold Corporation, 2018, “Annual Report – 2017”,https://barrick.q4cdn.com/808035602/files/annual report/Barrick - Annual - Report - pdf (accessed 16 June 2016)
- Li, S., Li, N., Li, J., Gao, Y., 2012, “Vehicle Cycle Energy and Carbon Dioxide Analysis of Passenger Car in China”, 2012 AASRI Conference on Power and Energy Systems
- Klocke, F. et al, “Simplified Life Cycle Assessment of a Hybrid Car Body Part”, 21st CIRP Conference on Life Cycle Engineering, https://ac.els - cdn.com/S221282711400479X/1 - s2.0 - S221282711400479X - main.pdf? tid=b0a3ffbd - fcb1 4da1 - b3db - 6e5c64c1bdb4&acdnat=1529169975_cf97c708ac6e9f9292741e2de1a7fe71
- De Wolf, C. et al, 2017, “Measuring embodied carbon dioxide equivalent of buildings: A review and critique of current industry practice”, Energy and Buildings, Volume 140, pp 68-80
- European Chemical Transport Association, 2011, “Guidelines for measuring and managing CO2 emission from Freight Transport Operations”,http://archive.is/w4SLX
- Carstens, A., 2018, “Money in the Digital Age: what role for Central Banks?”, Bank for International Settlements
- Digiconomist, 2018, “Bitcoin Energy Consumption Index”,https://digiconomist.net/bitcoin - energy consumption#assumptions (accessed 13 July 2018)
- Bitcoin Wiki, 2014, “Maximum Transaction Rate”,http://archive.fo/cEbfv
- network, 2018, “Lightning Network – Scalable, Instant Bitcoin/Blockchain Transactions”,http://archive.fo/ggPPy
- Lightning Network Explorer, 2018,https://lnmainnet.gaben.win (accessed 31 July 2018)