Introducing SOPR: spent outputs to predict bitcoin lows and tops
| If you find WORDS helpful, Bitcoin donations are unnecessary but appreciated. Our goal is to spread and preserve Bitcoin writings for future generations. Read more. | Make a Donation |
Introducing SOPR: spent outputs to predict bitcoin lows and tops
PostedRenato Shirakashi
By April 25, 2019
One of the best things about Bitcoin is how the data is available for analysis. The blockchain itself can provide a lot of information on the money flow, and from these we can infer a lot on people’s sentiment and behavior.
In this analysis two important psychological turning points that significantly change the supply of bitcoin are going to be described by introducing a new oscillating indicator that signals when these major supply changes occur, using blockchain data.
Introducing the Spent Output Profit Ratio (SOPR)
The SOPR a very simple indicator. It’s calculated from spent outputs. It’s the realized value (USD) divided by the value at creation (USD) of the output. Or simply: price sold / price paid.
When SOPR > 1, it means that the owners of the spent outputs are in profit at the time of the transaction; otherwise, they are at a loss
By plotting the SOPR of all spent outputs combined, aggregated by the day in which they were spent (using blockchain date), the graph can be produced
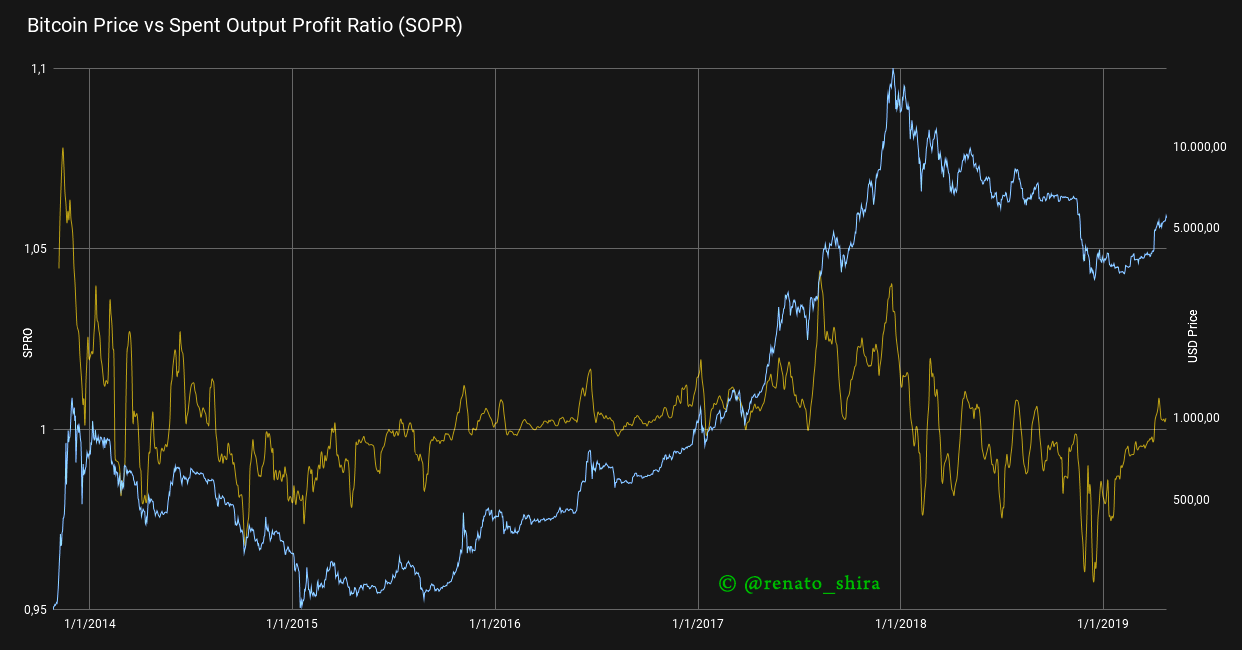 SOPR (sma 10) vs Price
There are several interesting observation that can be made from the chart above. First of all, SOPR appears to oscillate around the number 1. Secondly, during a bull market values of SOPR below 1 are rejected, while during a bear market values of SOPR above 1 are rejected. Therefore, the SOPR oscillator could serves as a reliable marker for identifying local tops & bottoms. This feature is highlighted in the graph below
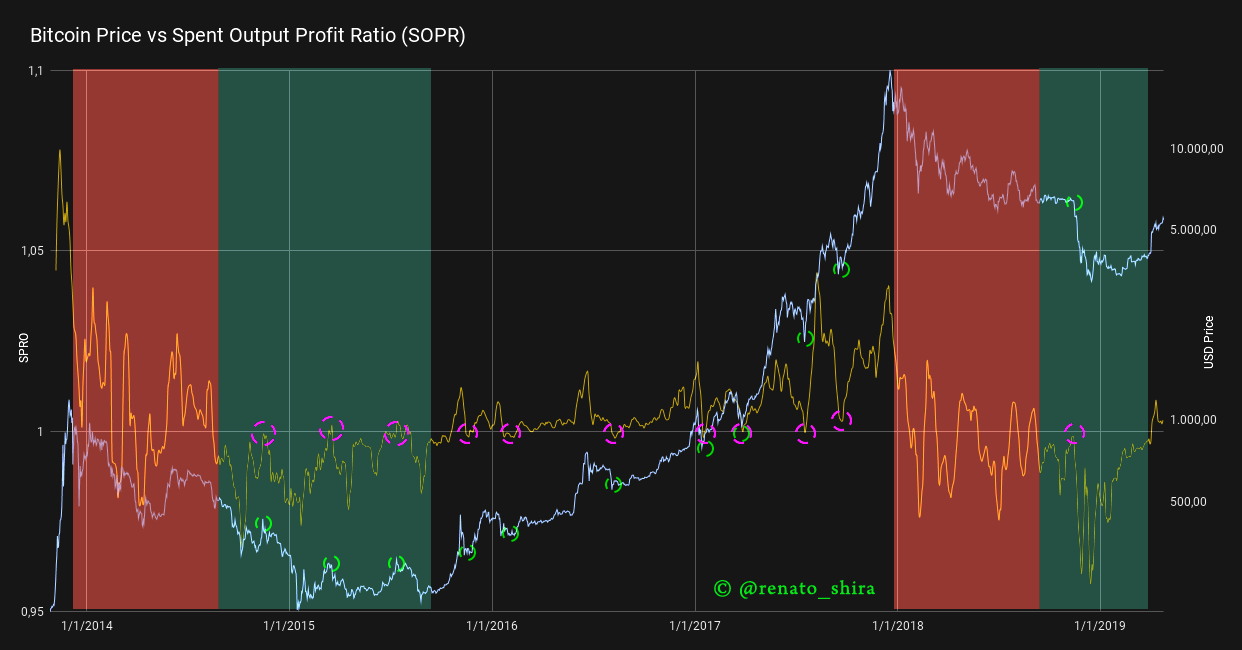 SOPR (sma 10) vs Price — Highlighted
Ignoring the areas in red, in which the SOPR is unstable (at the beginning of a bear market), it seems to work like a charm! But why?
People, in general, are much more comfortable selling when they are in profit(you can read more about this Daniel Kahneman’s work, Nobel prize 2002). In a bull market, when SOPR falls below 1, people would sell at a loss, and thus be reluctant to do so. This pushes the supply down significantly, which in turn puts an upward pressure on the price, which increases.
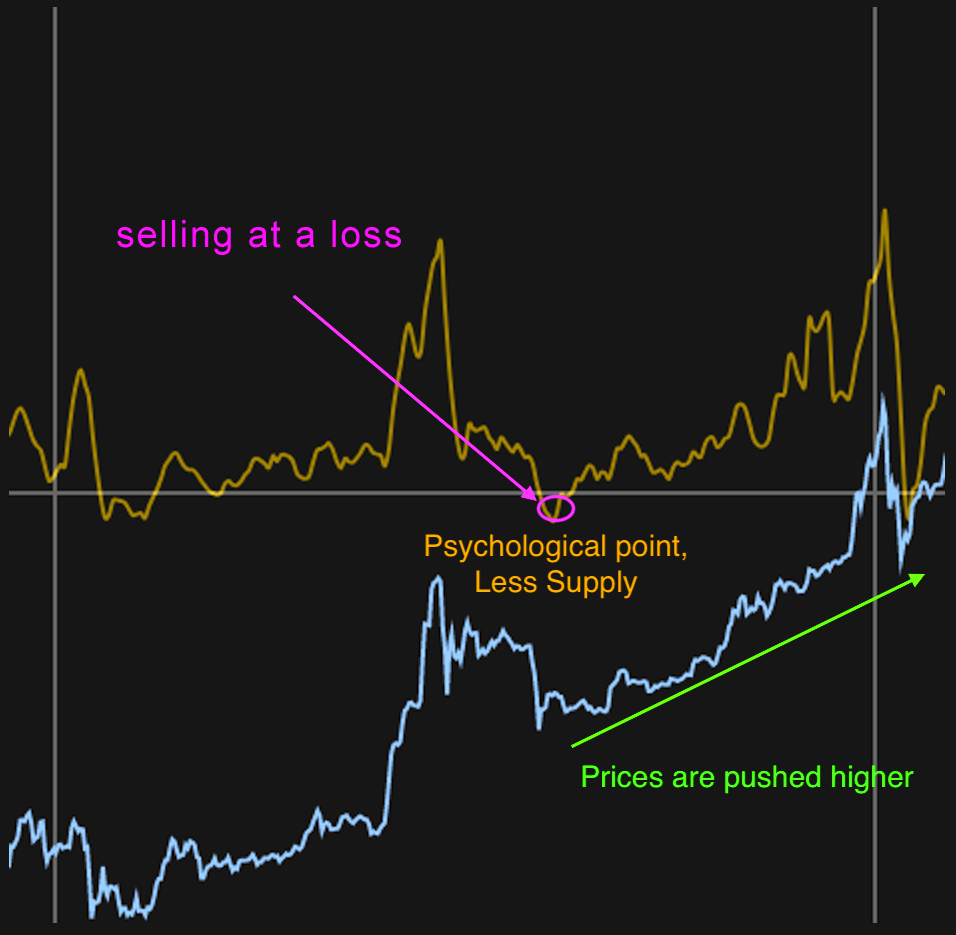 Bull market example
In a bear market, everyone is selling or waiting for the break-even point to sell. When SOPR is close/greater than 1, people start to sell even more, as they reach break-even. With a higher supply, the price plunges.
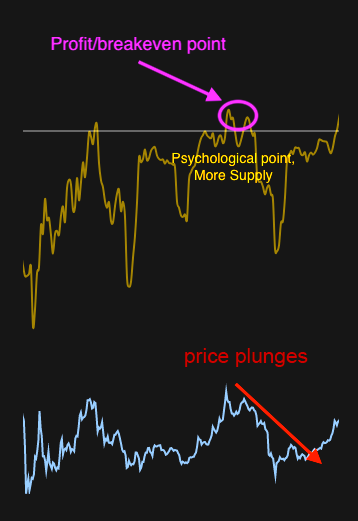 Bear market example
Due to the fundamental nature of underlying metrics on which the SOPR relies on, it would be fair to speculate that the Spent Output Profit Ratio is influencing price changes. This can be of considerable significance, since most current indicators are lagging indicators.
Next steps will be to further explore SOPR using different time-frames for the spent output as well as value sizes.
Interesting things to notice:
- SOPR suggests the bull run is starting
- SOPR also suggests the capitulation in 2018 was, technically speaking, pretty nasty ; and yes, there was pain,even when compared to 2015.
This is a preliminary work, if you want to have updates on this and future work, please follow me on twitter: @renato_shira
Revision by: @cryptopoiesis