
Bitcoin’s True Market Dominance
| If you find WORDS helpful, Bitcoin donations are unnecessary but appreciated. Our goal is to spread and preserve Bitcoin writings for future generations. Read more. | Make a Donation |
Bitcoin’s True Market Dominance
Analysing Bitcoin’s true market dominance, taking liquidity into account. A new metric, Volume-Weighted Cap, is derived and shows that Bitcoin has Pareto dominance (>80%) on the market.
By JP Thor [ ₿ ⚡️]
Posted March 22. 2019
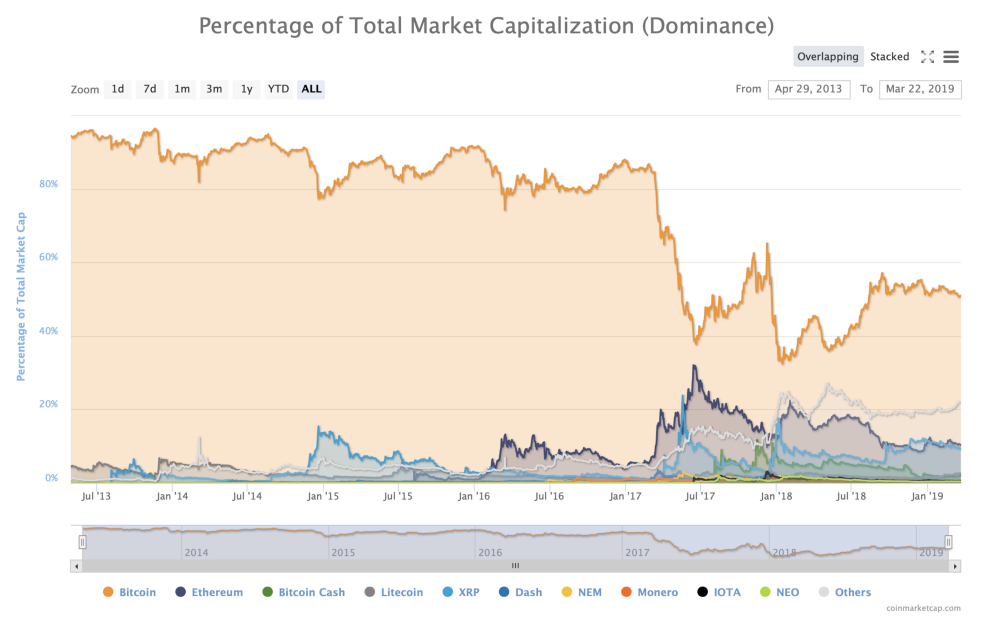 CMC’s Market Dominance — a flawed metric
Browsing twitter recently I saw a tweet quoting Vitalik, the infamous founder of Ethereum, from some podcast:

I took the comment to be rather disingenuous, knowing that Vitalik enthralls at every chance to show mathematical edge. He seemed to be referring to CoinMarketCap’s “Market Dominance”, a metric fixated on by many, despite being based on “market cap” — a lamented metric. Market Cap on CMC is simply the market price multiplied by circulating supply, which many argue can easily be manipulated by things such as low volume, pre-mines and circulating supply malfeasance.
I immediately wondered if market share was some form of Pareto-distribution, “the law of the vital few, or the principle of factor sparsity”.Pareto Distribution is itself a form of Power Law, and is often observed in nature where the rule of equilibrium abounds.
Considering that cryptocurrency trading is practically a free market (very few externalities), I posed the hypothesis that it was a Pareto distribution, and set out to test it.
Pareto Distribution
The Pareto Distribution is given by the equation:
y = 20% ^(log(x)/log(80%))
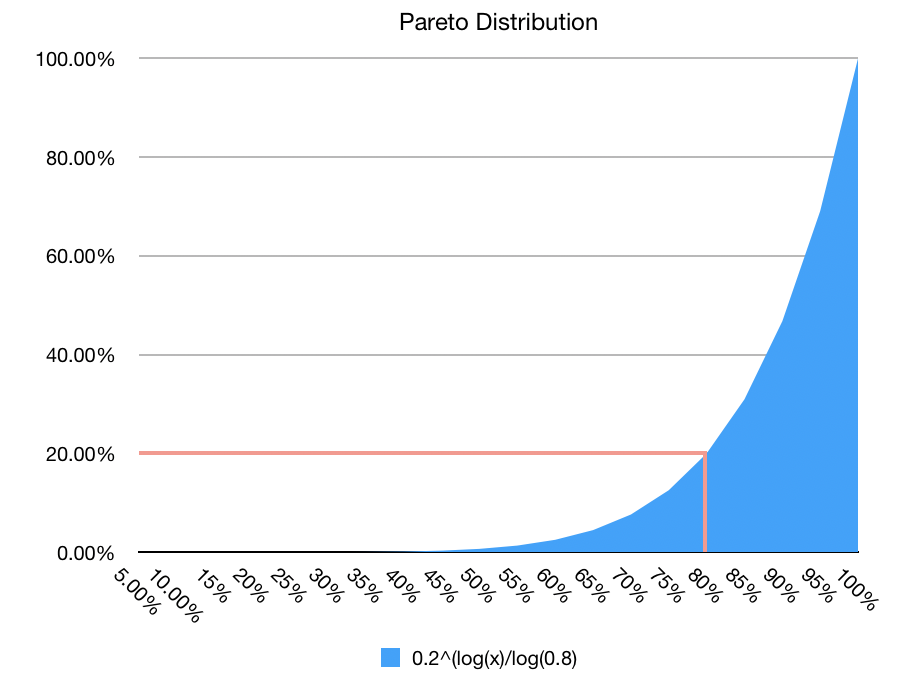 Pareto Distribution
The characteristic that is most notable is “80% is owned by the 20%, 20% is owned by the 80%”, which is quite easy to highlight. It is scale invariant — essentially no matter the scale spectrum, the distribution is the same. It can also be referred to as a fractal distribution since it looks the same at any level of zoom.
The Volume Problem
The Top 100 Coins and their MarketCap and Volume were plotted against a generic Pareto Distribution:
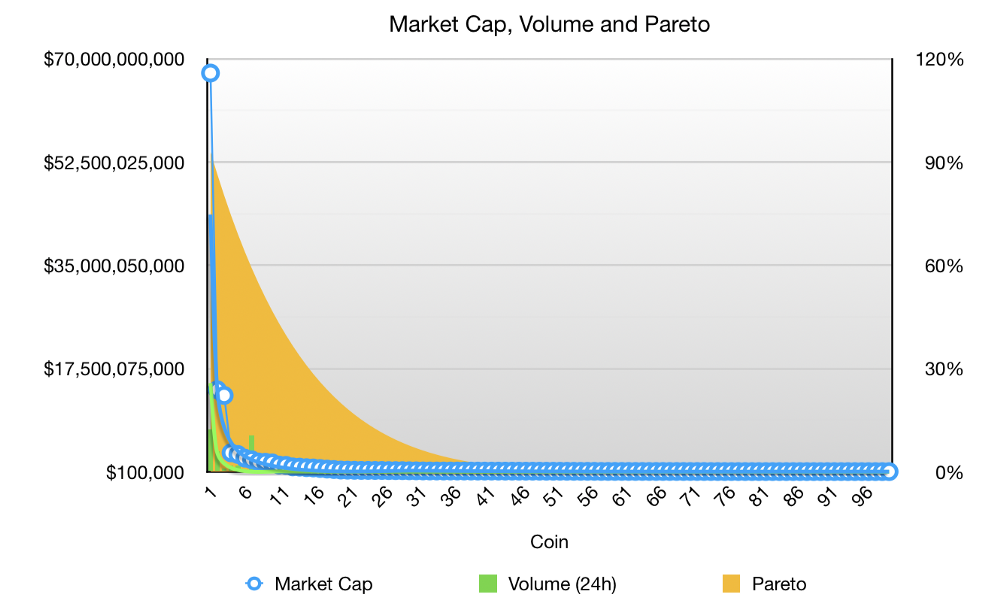 Not a Pareto Distribution
It wasn’t even closely aligned with a Pareto Distribution, and the linear scale wasn’t appropriate.
Switching to Log view, it was clear there was some form of Power Law Distribution.
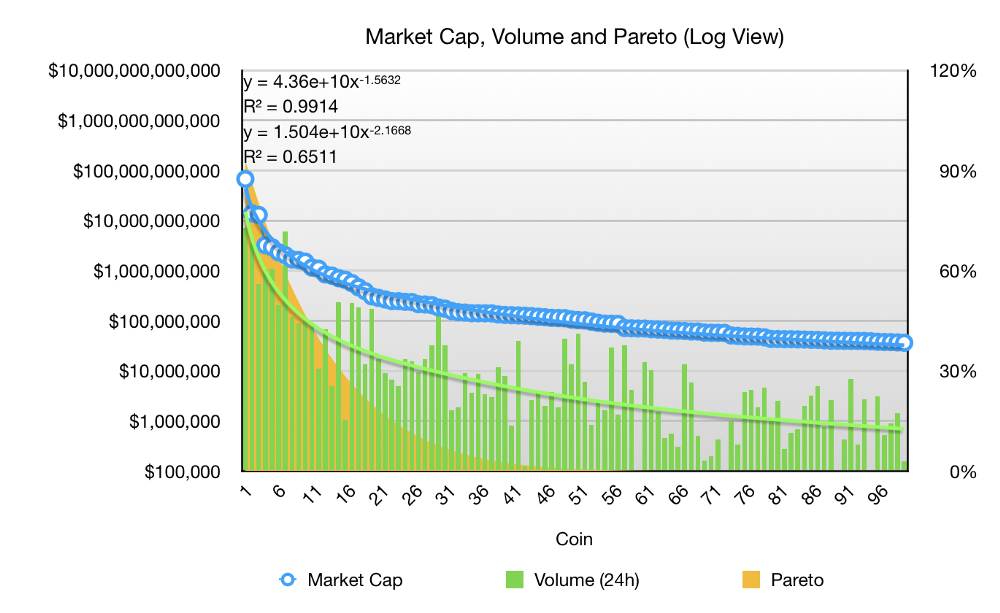 Poor volume correlation
While MarketCap had high a R² value (best-fit), which seemed natural since the coins were ranked in order of market cap, what was concerning to me was the low R² for Volume.I expected this to share the same distribution as market cap.
Low volume in some coins was indicative of a trapped market, and artificial market cap — some coins had less than 0.1% of their market cap in daily volume, compared to the Top 10, which all had >30% in volume/cap; a difference of more than two factors.
Volume-Weighted Cap
I deduced that Volume (liquidity) had to be weighted as a metric, so they were multiplied together to form another metric: “Volume-Weighted Cap ($²)”.The lower the volume, the lower the overall score.
Aggregating the last 12 months of records, averaging, then capturing the proportion of “Volume-Weighted Cap” over the Top 100 coins, the following plot was obtained:
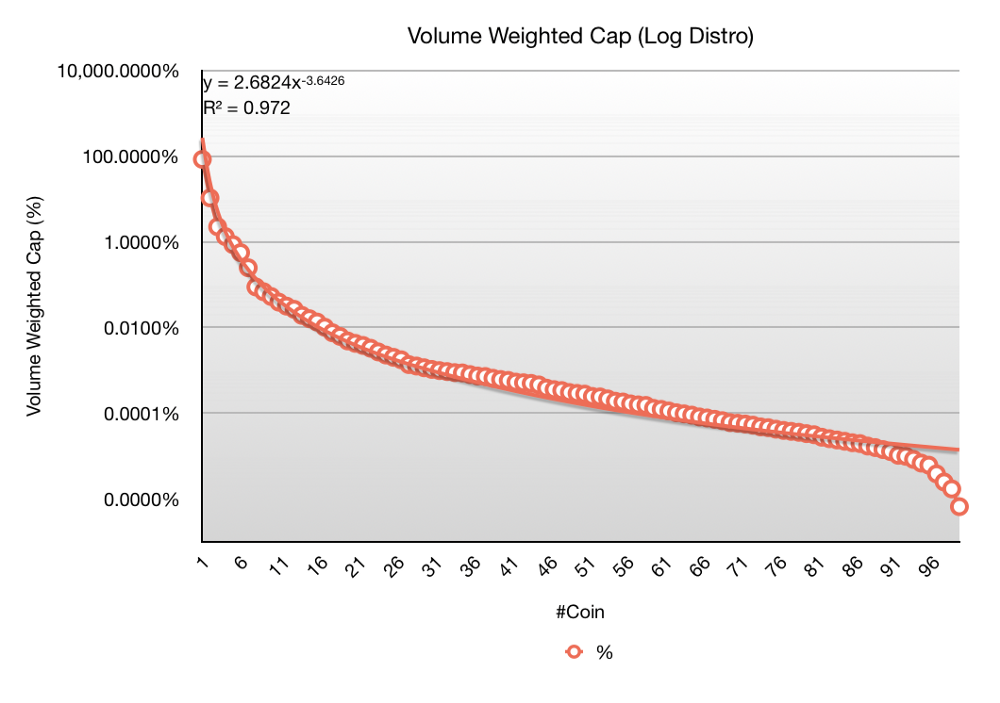 A surprising S curve
Firstly the R² value was noticed to be much higher, and an interesting “S” curve was observed. It seemed that the bulk of the average Top 100 complied with Power Law, before dropping precipitously towards the final 10 coins. Without doing further research into this, I hypothesised that it was the “Page 1 effect”, where coins that are in the Top 100 of CMC attract the most attention, and coins towards the end of the page drop in and out of the first page, losing interest as a result.
Removing the final 1/3rd of coins, the first 67 were plotted on a Log-Log scale, with very high correlation to Power Law:
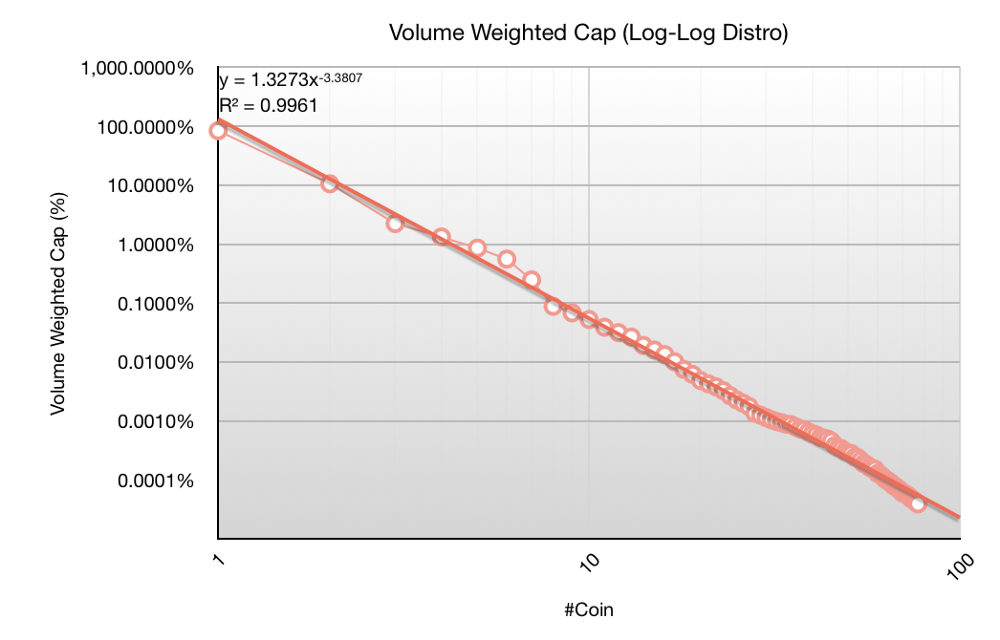 High correlation with Power Law
Sorting the Top 67 coins by Volume-Weighted Cap, and then plotting Market Cap and Volume, it was immediately obvious that the Power Law best-fit scores were cumulatively much higher.
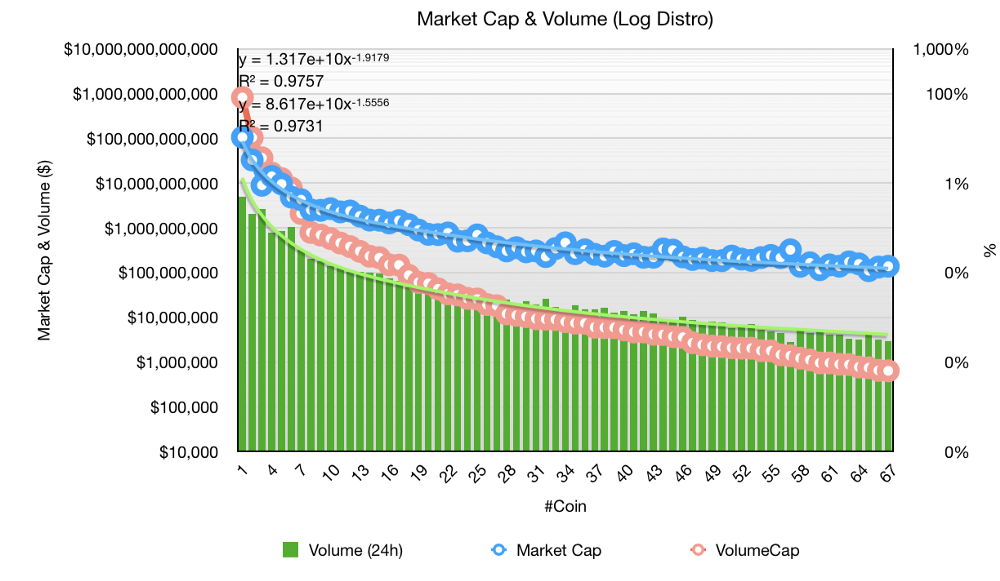 A much better sort for both Volume and MarketCap
Thus I concluded that the market spread was in fact a Power Law Distribution (but not strictly Pareto), and it required factoring in liquidity.
Volume-Weighted Market Dominance
Now returning to the original inspiration for the research, I sort to address what was the true dominance of Bitcoin, taking volume into account.
The last 12 months of Volume-Weighted Cap were plotted for Bitcoin, Ethereum and Others (which included Ethereum):
 Volume-Weighted Market Dominance for Bitcoin is 80% and trending up
It is clear that Bitcoin is the dominant currency when taking liquidity into account. In terms of share, it is consistently over 80% and trending up.
In fact, just taking into account the Top 5 coins, Bitcoin (the 20%) captures over 85% of the market — thus it is a Pareto distribution, and actually much stronger. This is only testament to how strong the Schelling Point around Bitcoin is.
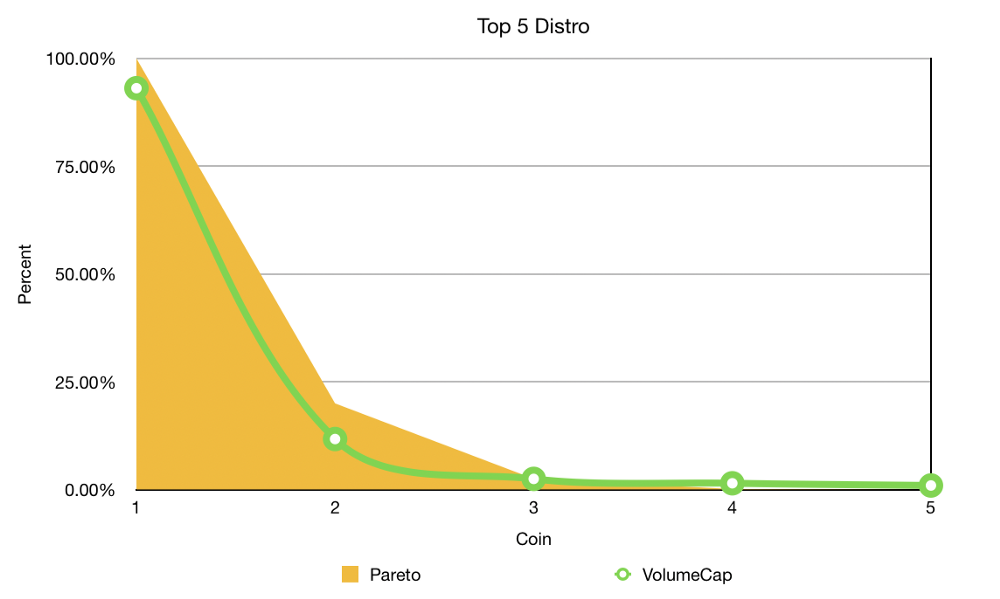 Bitcoin (#1) has Pareto Dominance in the Top 5
It is my opinion that Bitcoin will continue to preserve its Schelling Point, and maintain greater than 80% market dominance. CoinMarketCap’s “Market Dominance” is flawed since it does not factor in liquidity and the reported 55% is significantly understated.
Thus I conclude that Vitalik is mis-informed and lazy in his reference to CMC’s flawed market share of Bitcoin, when in fact, it is stronger than ever.
Follow me on twitter, I research and write about Bitcoin.