
Bitcoin’s Inflation Adjusted NVT Ratio
Bitcoin’s Inflation Adjusted NVT Ratio - An UpToDate Assessment
By cryptopoiesis
Posted September 18, 2018
 Noon. Herd in the steppe by Arkhip Kuindzhi c. 1895
This analysis aims to take a closer look at the NVT Signal/Ratio adjusted for Bitcoin’s inflation in circulating supply, in the light of recent price developments and comparing it to the original NVT Ratio/Signal developed by Willy Woo and Dimitri Kalichkin. The data of these ratios, provides a good insight regarding the current market cycle, as well as a better understanding of the wider perspective in regard to the relevance & applicability of these metrics going forward.
” Bitcoin’s NVT Ratio Normalised for Inflation in the Circulating Supply” will be referred to as: Wookalich Ratio for short and as credit to the developers of the original NVT Ratio & Signal. Whether that will be welcomed or disapproved off, remains to be seen.
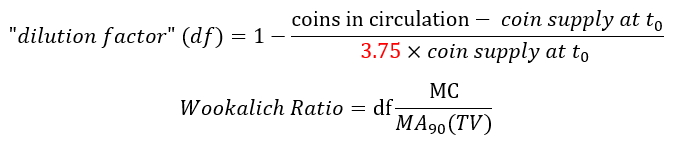
The rationale for adjusting the ratio was put forward in the article Bitcoin’s NVT Ratio Normalised for Inflation in the Circulating Supply .The Wookalich Ratio charted in this article differs slightly in methodology by further “normalising” / flattening the trend line: a denominator factor of 3.75 replacing the 4 in the equation bellow:
Furthermore, the Wookalich Ratio had been charted in this article using a different set of price, coin supply and market cap data. The graph below assesses the reliability of this data in comparison to that used to calculating NVT Signal on woobull.com :
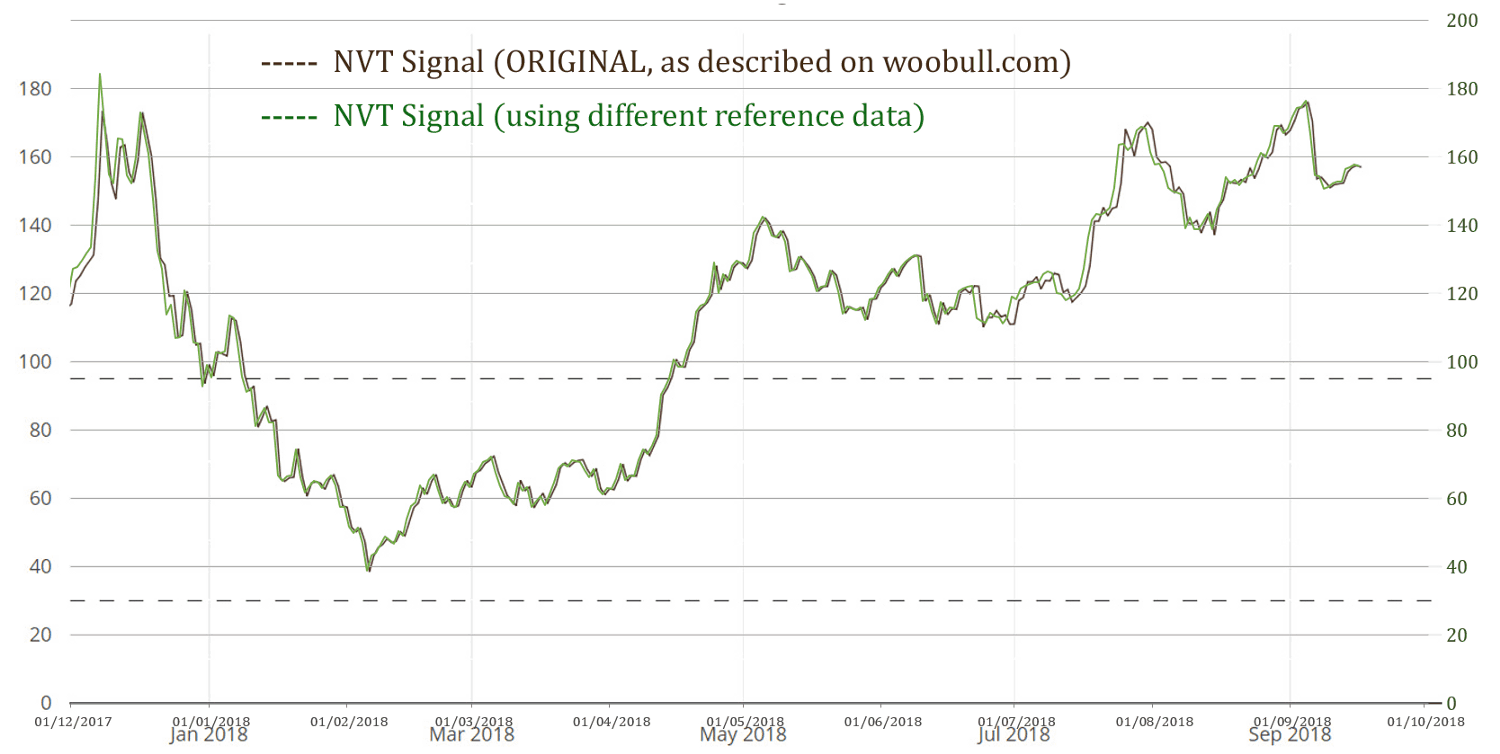
From the above chart, it can be concluded that the data is compatible, giving a virtually identical NVT Signal. The one subtle, nevertheless constant, difference is the slightly (1 day) leading “bias” generated by this data. The rationale and the methodology used for this reference data are succinctly described in the article: What is the Price of Bitcoin, or its Market Cap…. exactly?
NVT Signal & Wookalich Ratio Overview
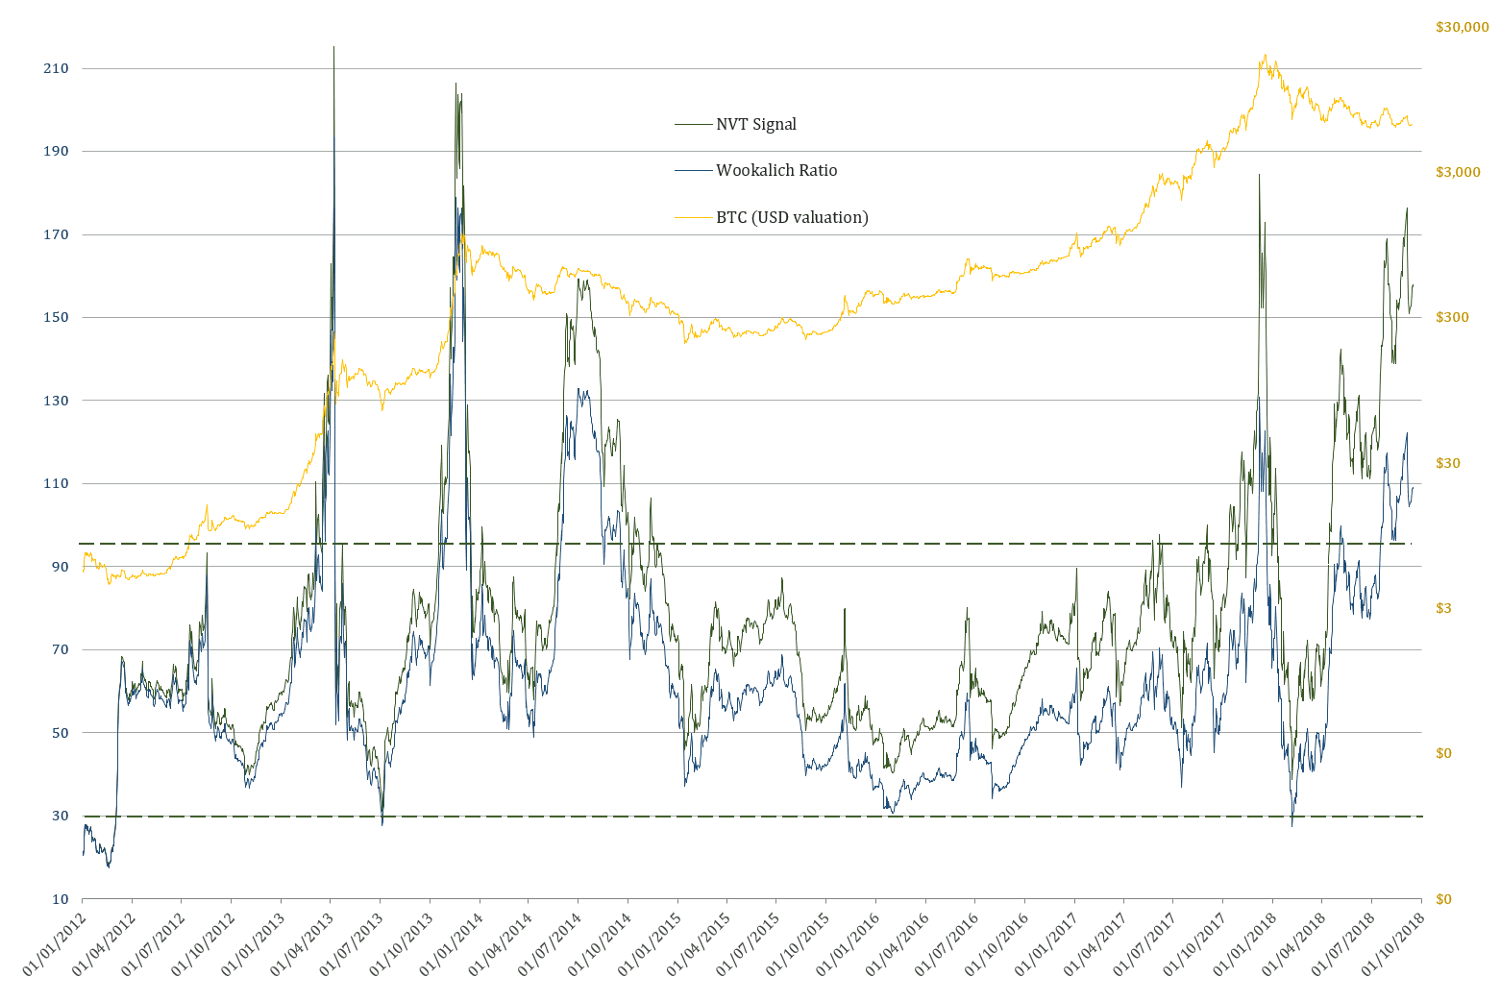
The Wookalich & NVT Ratios in all charts have been plotted against BTC dollar valuation instead of those of the Market Cap for the purpose of being more “user friendly”.
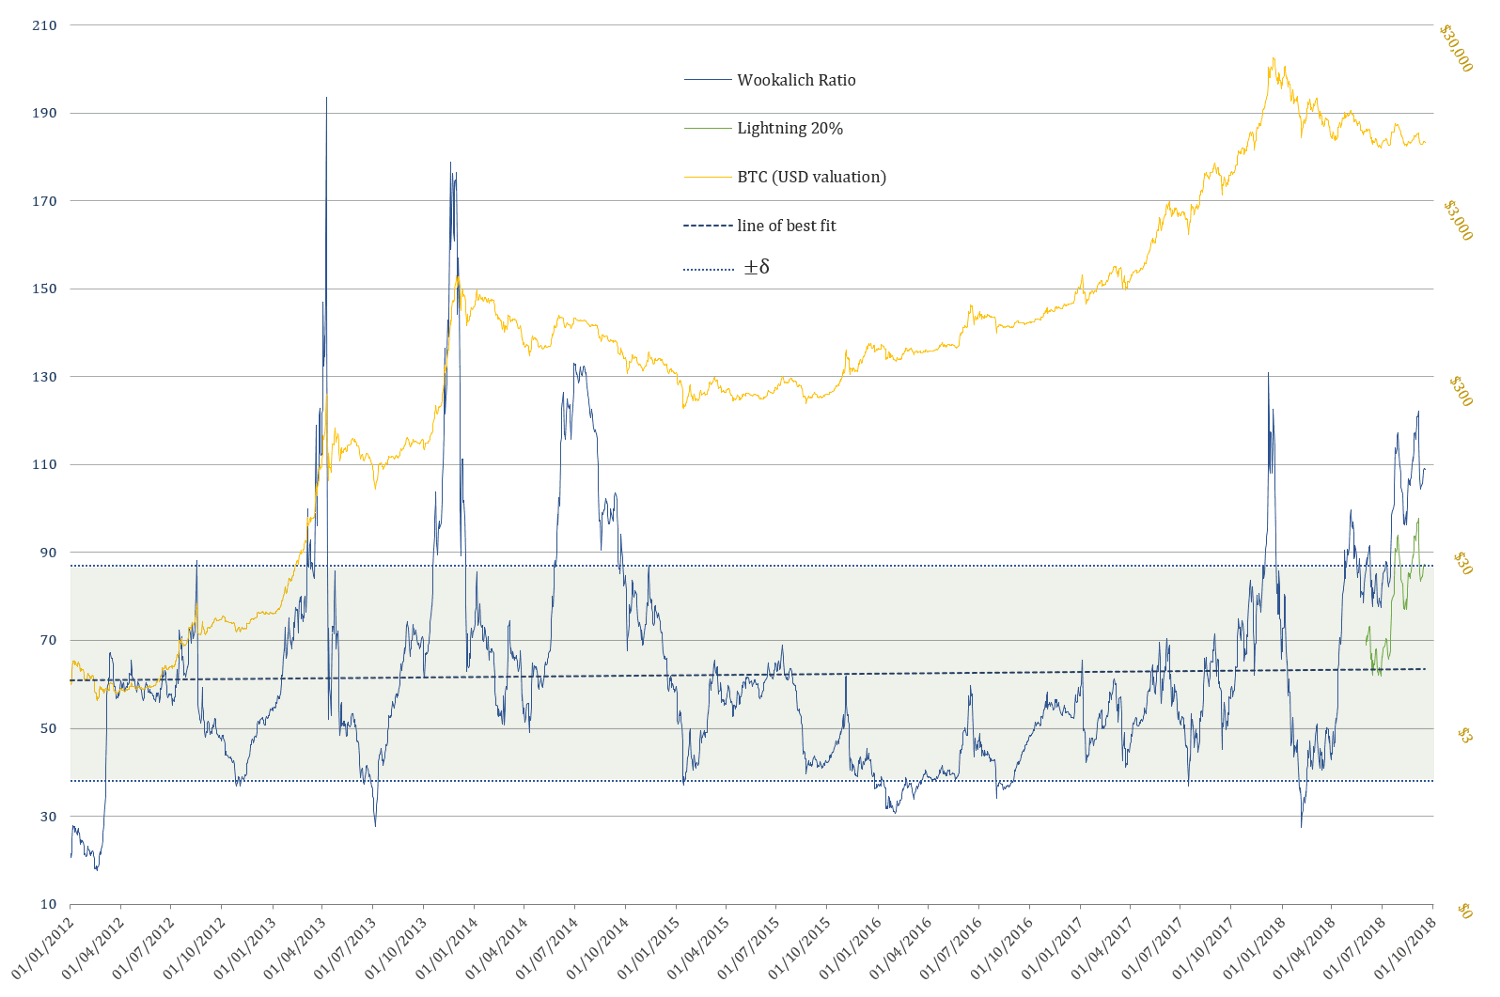
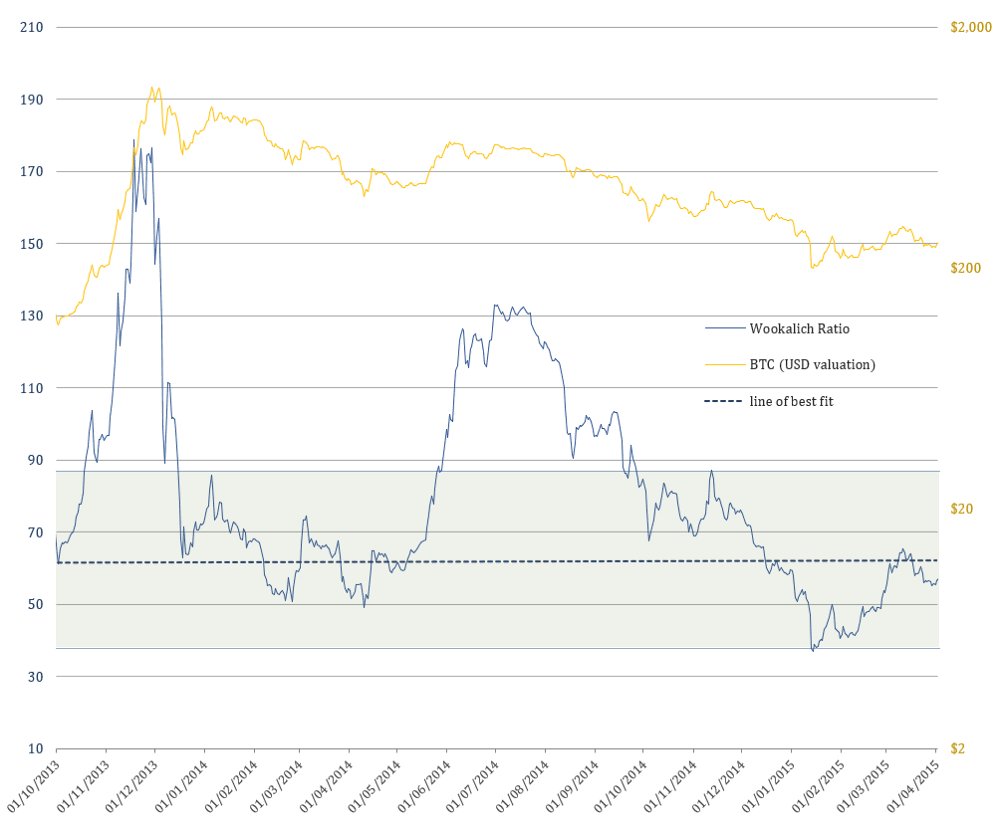
The Wookalich Ratio
 2012 — Present
Wookalich Ratio properties:
- Average value (since 2012): 62.24
- Standard deviation from the mean (±δ): 24.48
- Upper bound (+δ): 86.72 & Lower bound (-δ): 37.77
Taking into consideration the levels at which the line of best fit is currently at the following approximate key levels can be determined:
- Wookalich Ratio average: 63
- Upper “overbought” bound: 88
- Lower “oversold” bound: 39
Discussion
If one is to expect an oversold condition, close to an NVT Signal level of 30, similar to the 2015 capitulation, the price would have to drop to c. $1239, tomorrow, as would be the case in the coming few weeks.
However, if an oversold condition is expected to mirror the NVT Signal levels of 40, as was the case in the first 2017 “capitulation”, the price would “only” have to drop to c. $1653.
As for the denominator side of equation, the value transferred over the network has been steadily declining for a while. Furthermore, the fact that a 90 day moving average is used in calculating the NVT Signal & Wookalich Ratio ensures that this trend is not bound to change in the near future.
Another reason that no considerable uptick is to be expected in the on-chain TV is the increasingly adoption of Lighting Network, which, so far, remains an unknown quantity in terms of its measurable effect on the overall TV.
If the large values are transferred by rich investors, speculators and exchanges, which until very recently would have had to be solely settled on-chain, now they have the option and every incentive to make use of the Lightning Network. The “smart money” can afford being smart, thus be managed with competency on the technical part as well.
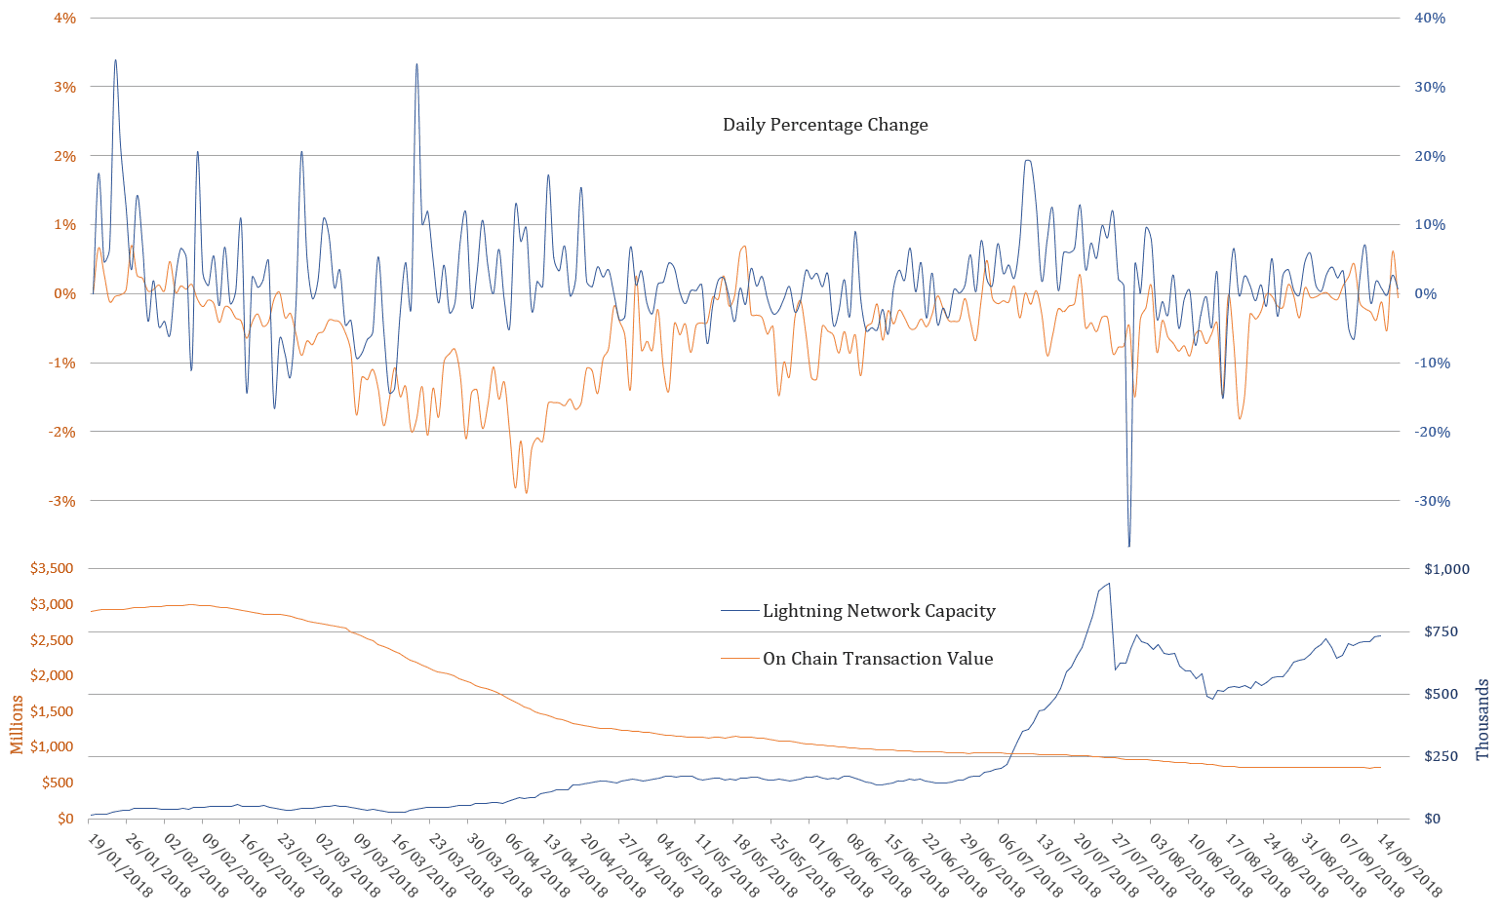 Note: On Chain Transaction Value and it’s percentage change refer to the smoothed 90d MA (as the one used in the ratios)
As highlighted in Brief Observations and Questions on the Lightning Network’s Effect on Bitcoin’s NVT Ratio, the Lightning Network Capacity is continuing to grow and does correlate with the on-chain TV (using percentage change). This can only be seen as proof that it is very much alive and kicking, mimicking the “on-chain behaviour”. Hence it has the potential to serve as proxy in estimating a more inclusive / overall transaction volume.
The Wookalich Ratio despite being “fudged” / normalised, it does not, however, offer any significantly less of a dire / bearish outlook. If one is expecting the metric to go into “oversold” territory (e.g. 1 standard deviation below the mean), tomorrow or in the coming weeks, the price would require taking a deep dive toc. $1615. If we are to assume that Lightning Network capacity handles 20% of the overall value transfer, the same “oversold” threshold would be reached at c. $2918.
Looking back for clues into a more volatile past
 2014 Bear Market
The Wookalich Ratio could, however, signal an “oversold” level in the coming weeks, without a dramatic free fall in price, only if we are to assume the possibility that the lightning network takes care of approx. half of the overall value transfer. In this scenario an oversold level would be reached by dropping to a value of c. $4671 as of today.
Looking down a cliff or across the plains in the middle of nowhere?
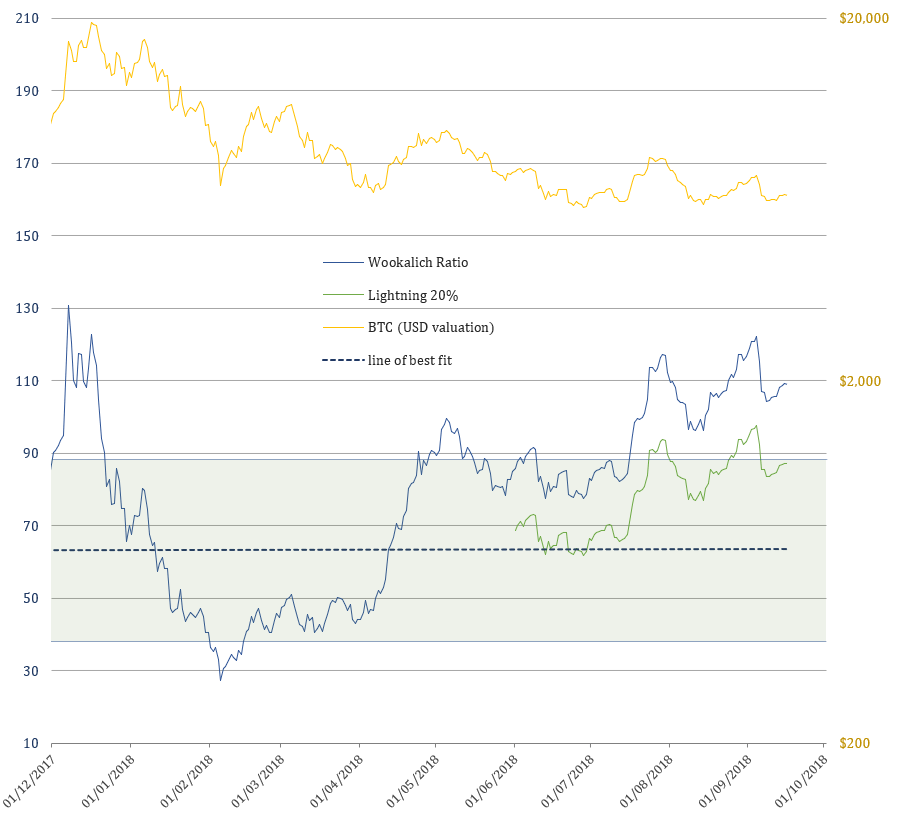 2018 Bear Market
Conclusion
If the Wookalich or NVT Signal /Ratio are to serve any purpose in the future, a method of quantifying and incorporating the transaction value over the Lightning Network would be essential.
Settling just for the on-chain transaction will increasingly make this metric less relevant, much like trying to assess combustion engines in terms of horsepower and continuing to attempt to match it against that of an actual horse.
The Lightning Network Capacity could serve as a proxy metric in estimating a more inclusive TV. To what extent however, remains to be answered.
Acknowledgements
- Willy Woo
- Dmitry Kalichkin & Cryptolab Capital
Disclaimer
The content is only to be take as my personal observations and opinions for the purpose to be further considered, answered or discarded, hence this article is far from exhaustive and IS NOT and CANNOT serve as basis for any financial / investment / trading advice.