Bitcoin Network Momentum
Bitcoin Network Momentum
A new leading indicator for Bitcoin price during its major market cycles
Philip Swift (@PositiveCrypto)
October 18, 2018
There have been some exciting developments in blockchain analysis over the past few months. Highlights include:
- Willy Woo’s NVT Ratio and Dmitry Kalichkin’s NVT Signal
- Recent work presented by Nic Carter at this year’s Honey Badger conference
- The subsequent MVRV (Market Value to Realised Value) paper written by Murad Mahmudov and David Puell
This sort of analysis is valuable and unique to the world of cryptoassets. For the first time, absolutely anybody who is investing in a particular asset can observe its underlying activity and performance — by using blockchain analysis.
This is not possible for the average investor investing in traditional stocks and shares. In those markets leading fund managers and top company execs are typically the only people who know in real time what’s happening within the underlying business of any given stock or share. So if you find the idea of cryptoassets bringing financial equality to the world exciting, then it is essential to understand the role that blockchain analysis plays in that.
Bitcoin Network Momentum is another piece of the puzzle to help our understanding of Bitcoin fundamentals and their impact on price. Bitcoin Network Momentum looks at the relationship between Bitcoin’s price and the BTC value of daily transactions flowing through the blockchain.
It is important to note here that we are using the BTC daily value flowing through the blockchain, not the USD daily value which NVT Signal uses.
What we see when we look at this is that the BTC value of daily transactions acts as a leading indicator of Bitcoin’s major market phases.
Note: This article will also discuss the recent introduction of Bitcoin Liquid and its impact on blockchain analysis metrics.
Bitcoin Network Momentum and its relationship with price
When we overlay Bitcoin’s price with the BTC value of transactions running through the blockchain each day, we see that they both follow patterns.
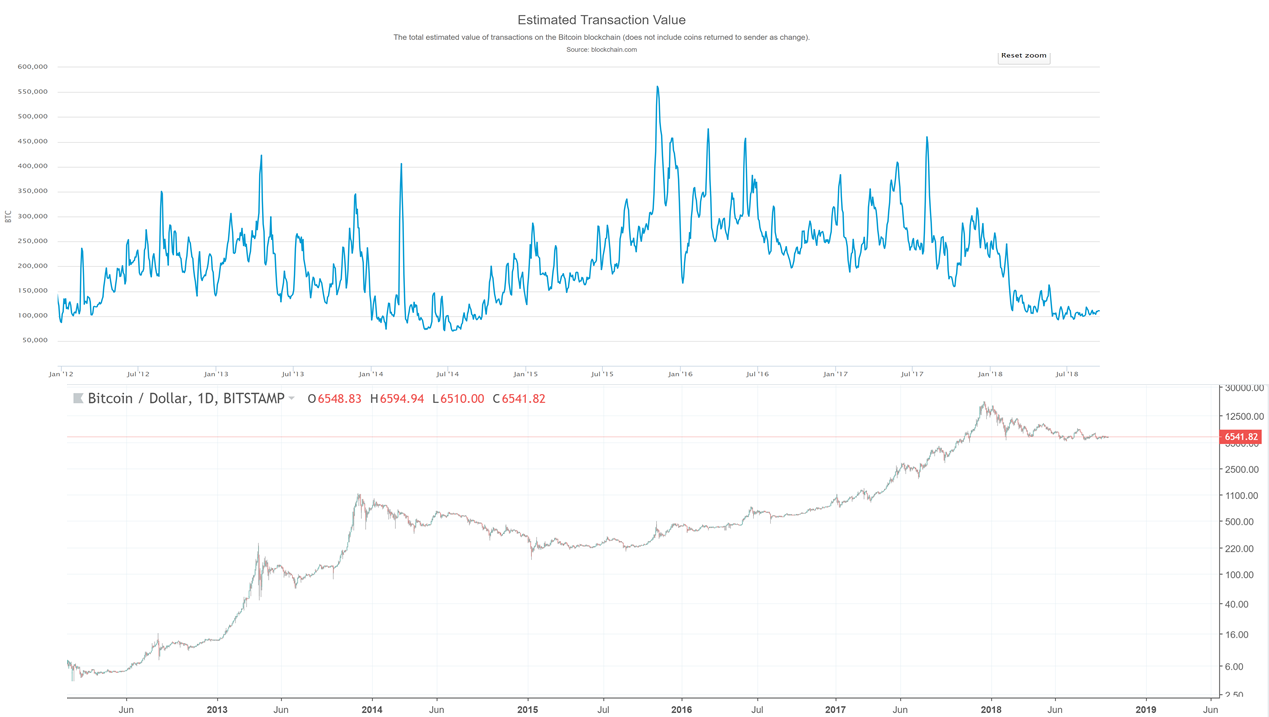 Daily Network Transaction Value (in BTC) and Bitcoin price chart.
At first glance, it is clear that both daily transaction values and price move in cyclical patterns, but that those patterns are not in sync with each other.
On closer inspection, we see that BTC daily transaction values provide a leading indicator insight into what stage of the market cycle price is at and therefore where price is likely to go next.
This can be broken down into three phases as we can see when we look at the previous market cycle:
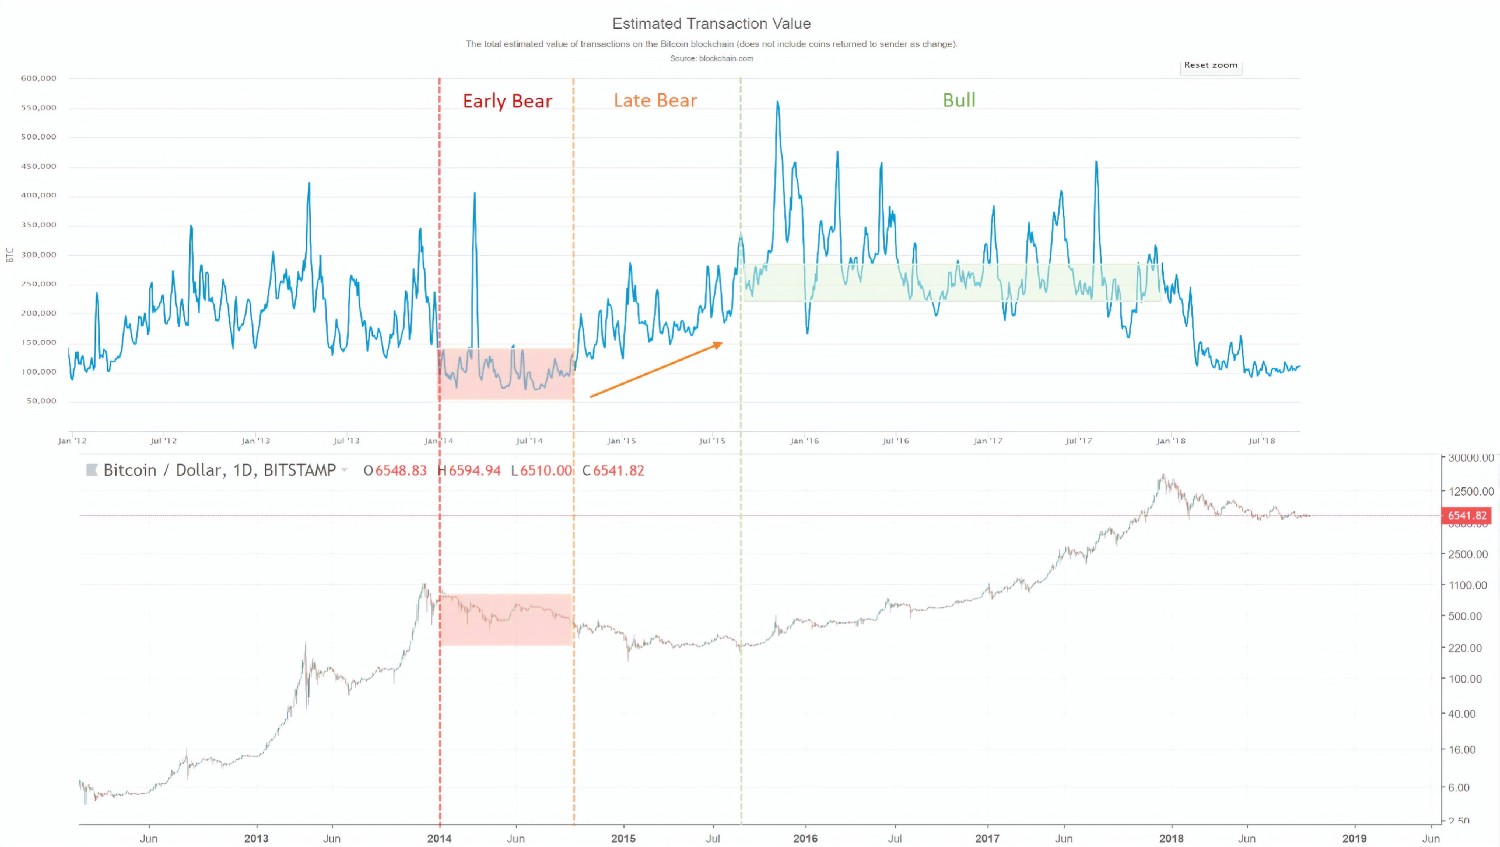
- Early Bear phase: Daily transaction values have dropped right down to around 100k BTC a day. Price is falling.
- Late Bear phase: Daily transaction values are rising. Price is broadly flat.
- Bull phase: Daily transactions have reached a sufficient minimum value (220k in the last market cycle, 150k in the one before) where the market finally responds and price starts to increase. We will explore in a moment why this phenomenon occurs.
So by monitoring the blockchain momentum in this way we are able to identify when we are closing in on the start of the next BTC price bull run.
Why is network BTC daily transaction value a leading indicator to Bitcoin price?
To understand this, we need to recognize that there is a divergence in behavior between short-term market participants who are dictating short-term price action, and longer-term HODL’ers and investors who are purchasing Bitcoin on-chain.
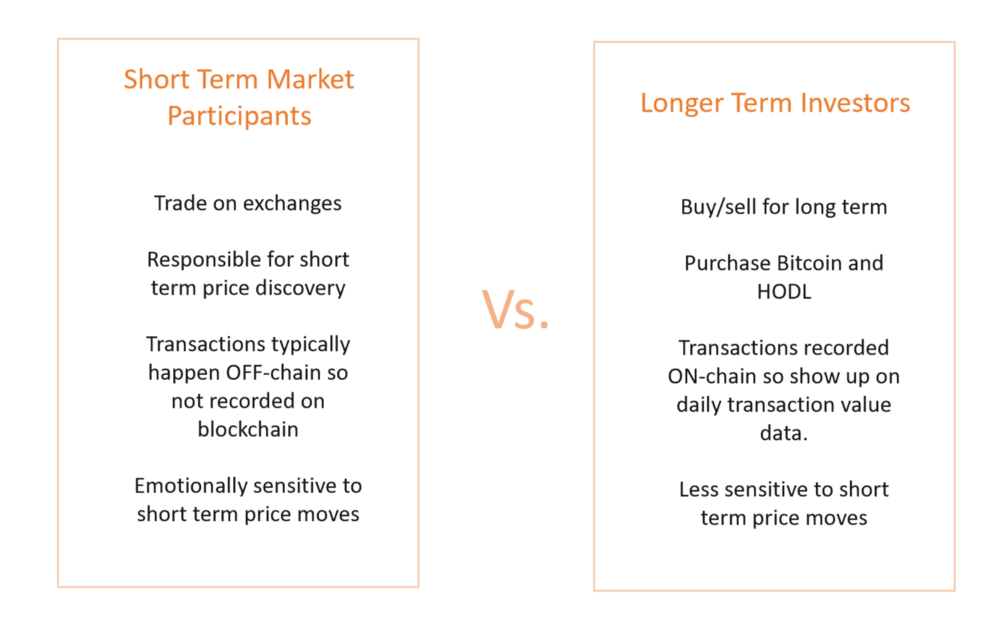
This explains why we see both daily transaction values and price exhibit cyclical patterns but not in sync with each other. Both are driven by different human emotions and motivations.
Short-term mindset traders heavily influence the Bitcoin price, long-term mindset investments are more likely to be recorded on the blockchain so have a greater contribution to the network BTC daily transaction value.
So why does price lag behind when daily transactions are initially increasing during that Late Bear phase we saw in the previous chart?
At this stage as short-term mindset market participants continue to sell, big buyers with a long term view are stepping in. The buyers’ volume steadies the price decline over time and creates the sideways accumulation zone where sells are roughly equal to buys. More and more smart money investment starts to come in until eventually the ‘healthy’ level of BTC daily transactions is reached. This is the point where the general market herd realizes that things are looking good again for Bitcoin (with its strong level of daily blockchain activity) so price goes up and the next bull market and FOMO cycle starts all over again.
It is worth remembering that this Late Bear phase needs to occur before we see a significant price increase. Which is why I become concerned when I see people expecting the price of Bitcoin to jump up immediately on news stories about institutions planning to buy into crypto. Even if they do, we still need actual network daily transaction value in BTC terms to increase to a sustained healthy level before price reacts in a significant way.
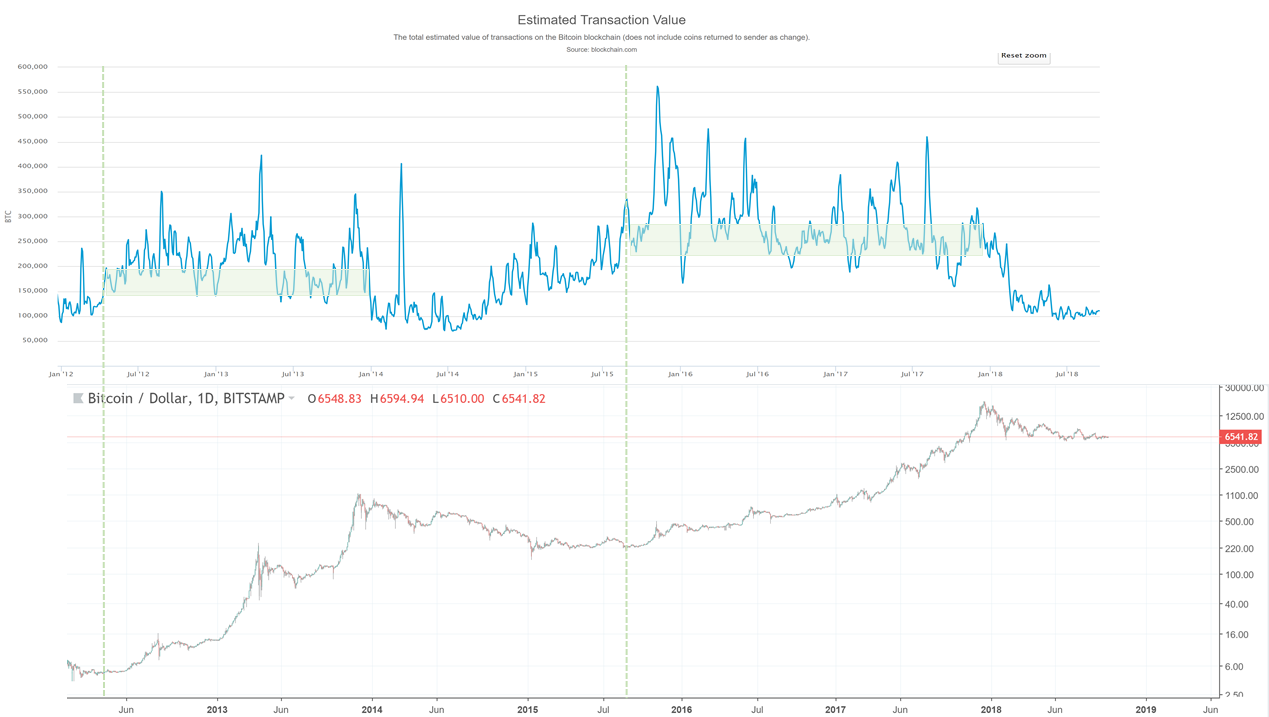 The minimum daily transaction levels of the previous market cycles that kicked off the new bull runs for BTC price.
This principle, therefore, helps to explain why we are seeing opportunities highlighted by other blockchain indicators such as MVRV (Market Value to Realized Value) and NVT Signal. For example, when we look at MVRV we can now understand that the market value picks back up above the Realized Value because the network’s daily transactions in BTC terms have reached their healthy level and confidence comes back into the market from both short term and long term mindset investors.
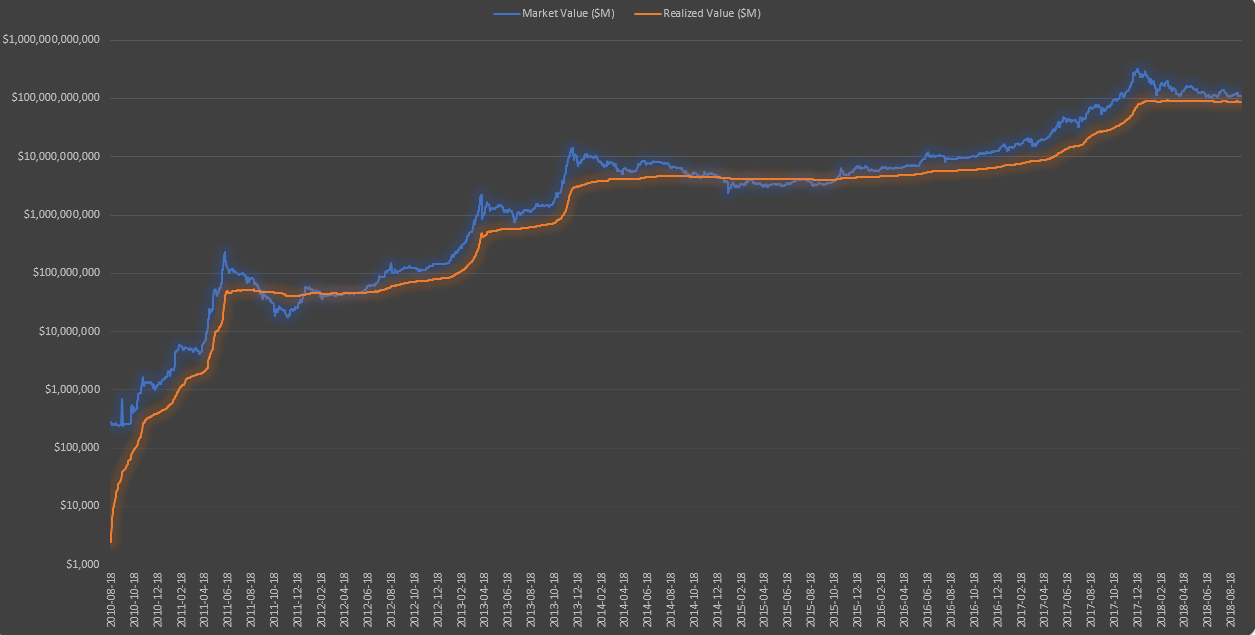 Market Value to Realized Value Ratio (MVRV)
What we can expect going forward for the next bull run
Daily transaction values are currently low, at around 100k BTC. This means we still have to go through the Late Bear phase where transaction values rise before we start to see a new bull run and any meaningful price increases.
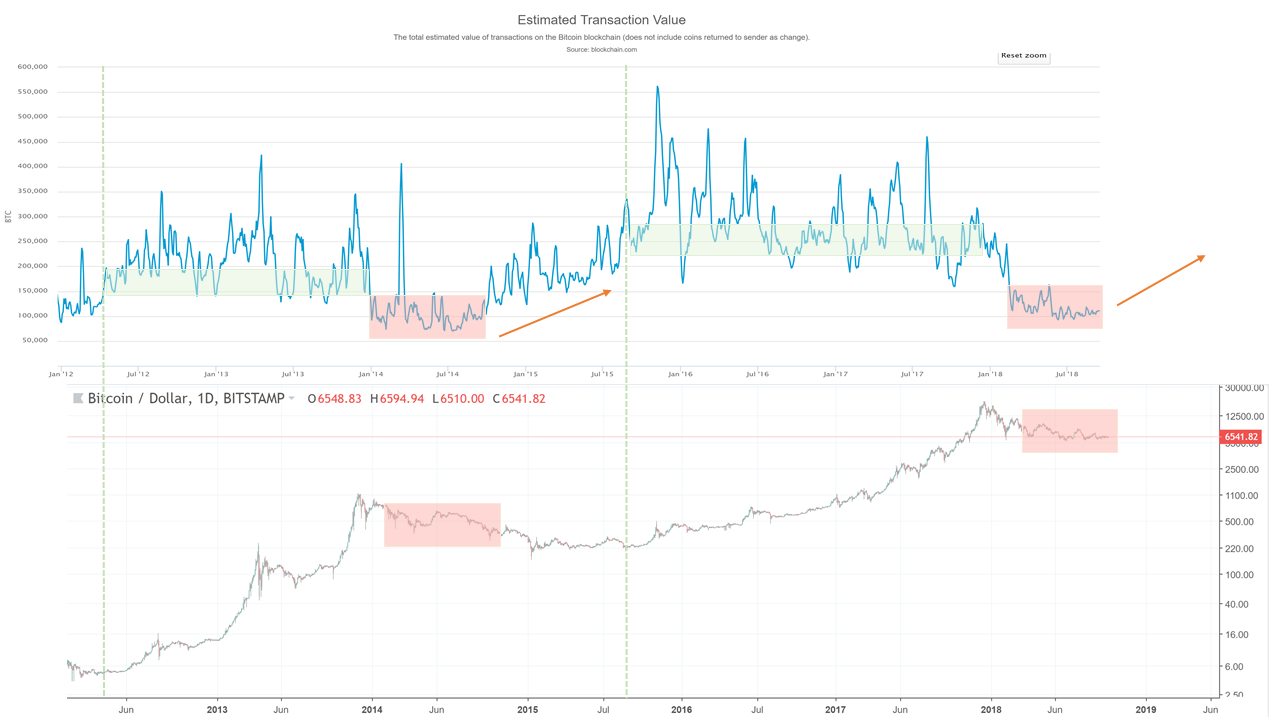 Bitcoin Network Momentum: where we need to go next.
You can see that the network’s healthy level kicking off a new bull run was higher in the 2015–2017 market than it was in the 2012-14 market. The reason for this is most likely due to the increased number of coins in circulation — shout out to Willy Woo for sharing this thought. As more coins become available, the healthy level of daily transaction value in BTC terms marking the start of the next bull run will need to increase.
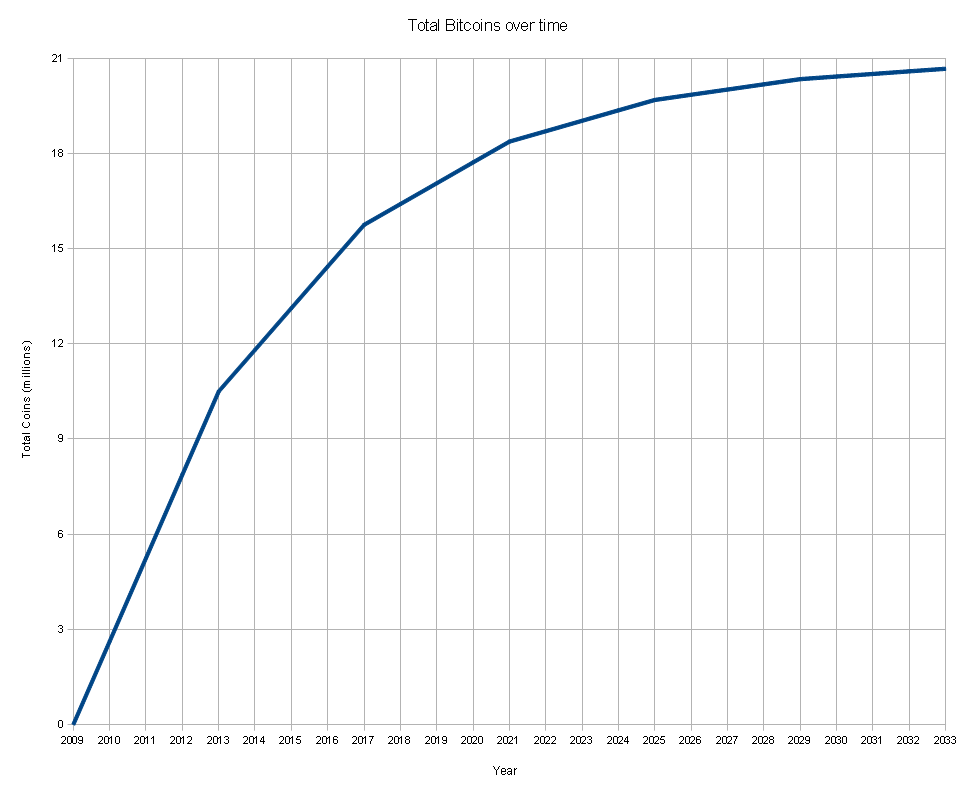 Projected number of Bitcoins in circulation over time
Bitcoin Liquid and its Confidential Transactions
Another factor that we now need to consider with this and other blockchain analysis is the recently launched Bitcoin Liquid. Bitcoin Liquid is a sidechain that allows large exchanges to transfer funds to each other off the main chain in a way that provides much faster and secure transactions. It also supports Confidential Transactions. This means that it will not be possible to view any of the transactions that use this service using blockchain analysis. This is significant because exchanges that account for 50–60% of all trading volume will now be using Bitcoin Liquid.
So does this make blockchain analysis such as Bitcoin Network Momentum and NVT Signal redundant if we now can’t see such a large proportion of transactions? Well, no it doesn’t, it just means that we no longer have the full picture of the total market. We will now only be able to analyse the remaining section of the market that isn’t using Liquid Confidential Transactions, which is still sizable.
One could argue this development will actually make such analysis cleaner as the blockchain transactions we see going forwards will capture less short term exchange driven transactions and have a higher proportion of transactions from long-term investors.
Either way, the data we see is still driven by human emotions and so we will continue to observe these cyclical patterns take place and therefore a relationship between the blockchain data and price.
In summary, Bitcoin Network Momentum is a valuable tool in helping us understand why Bitcoin price is at a particular point in the market cycle and also where it is likely to go next.
Given the currently low levels of daily transaction value flowing through the network it is likely to be several months before we start to see the next bull run. Daily transaction value will first need to rise to it’s minimum healthy level before we see price react positively in a sustained manner.
If you would like to check out an interactive chart of Bitcoin Network Momentum have a look on Willy Woo’s site here. If you found this article interesting you can follow me on Twitter here.
