
Introducing … The Bitcoin “MVRV Z” Metric That Predicts Market Tops with 90%+ Accuracy
Donate 10,000 sats to download and get the MVRV Z Metric plus 19 other Bitcoin Indicators in our Bitcoin Financial Journal pdf // Donate + Download Here.
Introducing … The Bitcoin “MVRV Z” Metric That Predicts Market Tops with 90%+ Accuracy
By Awe & Wonder
Posted October 9, 2018
Disclaimer: Not investment advice. Past performance is not indicative of future results.
Background:
The MVRV ratio was created by Murad Mahmudov & David Puell following Nic Carter’s (in a co-effort with Antoine Le Calvez) striking presentation at Honeybadger 2018. Building from Nic’s and Antoine’s conceptualization of realized value, the MVRV ratio was born.
In essence, realized value is closer to Bitcoin’s “fair value” as it adjusts for lost coins and coins used for hodling. The purpose of this article is to demonstrate the modified MVRV ratio’s usefulness with respect to market timing.
For a more extensive overview of realized value, please visit David’s & Murad’s original article describing this concept in detail. Bitcoin Market-Value-to-Realized-Value (MVRV) Ratio Introducing realized cap to BTC market cycle analysis blog.goodaudience.com
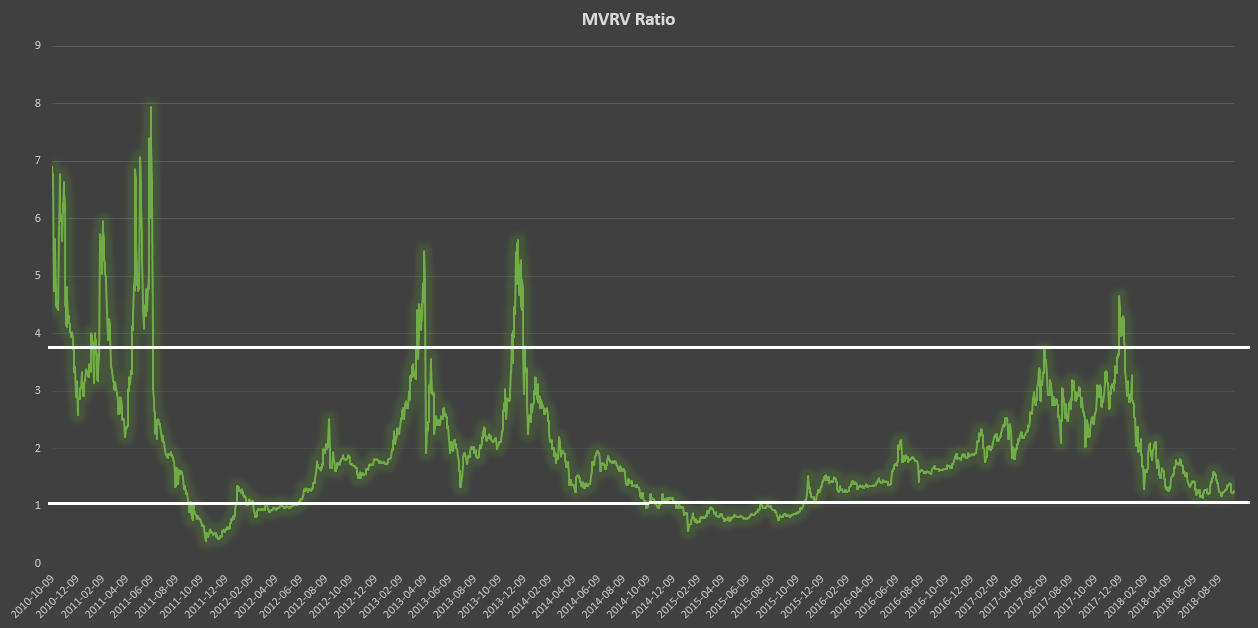 The original MVRV ratio described above is calculated by dividing market value by realized value on a daily basis. This provides the following oscillator:
As David stated, this metric clearly displays the peaks and busts of the price cycle, emphasizing the oscillation between fear and greed. The brilliance of realized value is that it subdues “the emotions of the crowds” by a significant degree. In other words, it is reasonable to consider realized value as a more accurate descriptor of Bitcoin’s stable, long-term value. Interestingly, it’s not too far-fetched to consider this area as the trend’s “psychological mean”; the zone where long-term holders see true value.
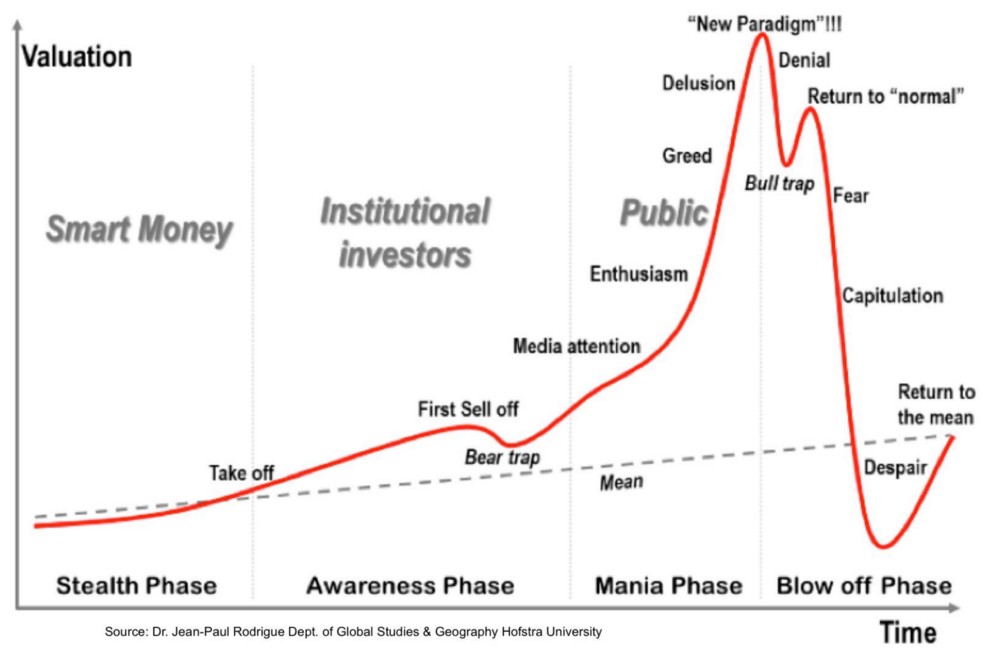 Realized Value as a proxy for the trend’s mean.
Market-Value-to-Realized-Value (MVRV) Z-Score
This new metric aims to measure the deviation between realized value and market value.
The modified MVRV ratio is just the z-score distance from the realized value.
Simply put, a z-score is the number of standard deviations above or below the mean. In this case, the realized value is used as a proxy for the true population mean. Therefore, this z-score transformation simply serves as a standardization technique and the standard deviations are not interpreted as one would in a normal distribution. This provides the following:
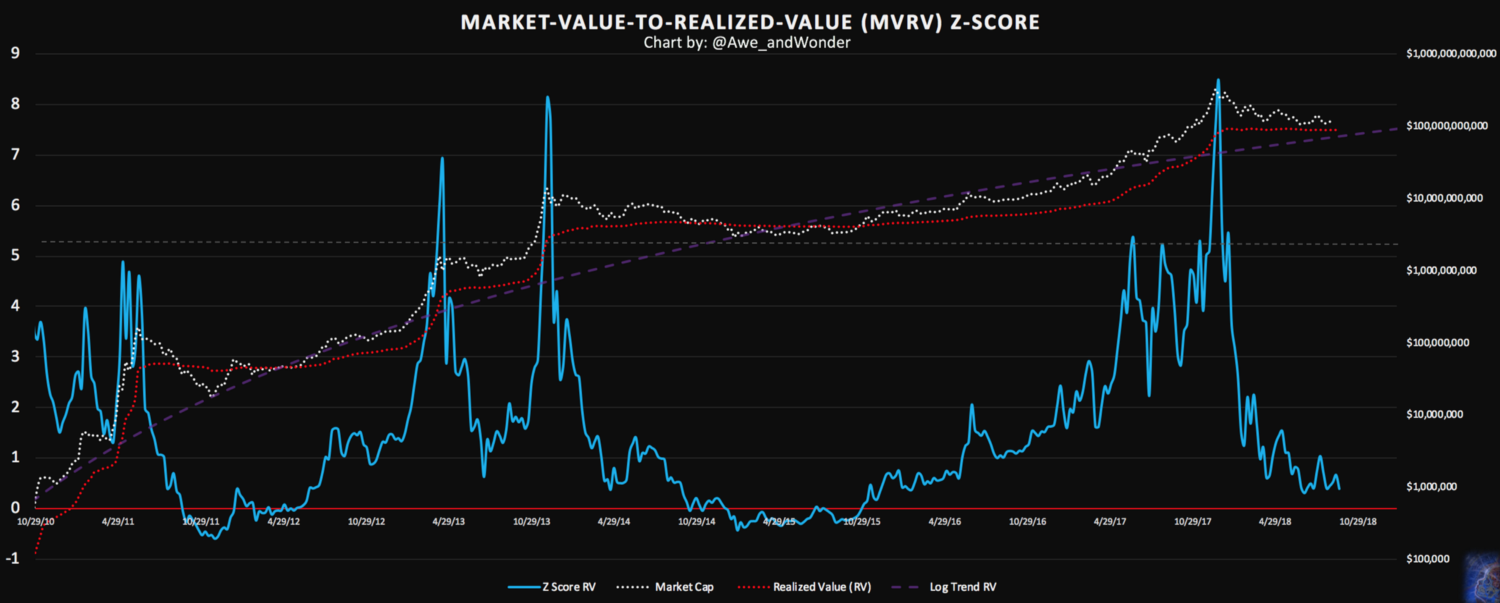 z-score distance from realized value as of 9/9/18
As you can see, the parabolic spikes triggered alarm one, two, and three weeks in advance, respectively. Coupling this metric with other buying climax patterns like say, daily returns exceeding two standard deviations from the mean makes for a killer combination.
Successful trading is all about finding and capitalizing on market imbalances. Markets that are in balance cannot be exploited.
Momentum (where strong moves beget stronger moves) eventually create market imbalances. The mean reversion effect, on the other hand, is a market’s response to excess momentum as it seeks to counteract this force. In a perfect random walk market, these forces eventually balance each other out. However, certain trigger events can tilt the scale in favor of one force winning over the other. This creates an environment where big moves can be reasonably expected to at-least partially reverse.
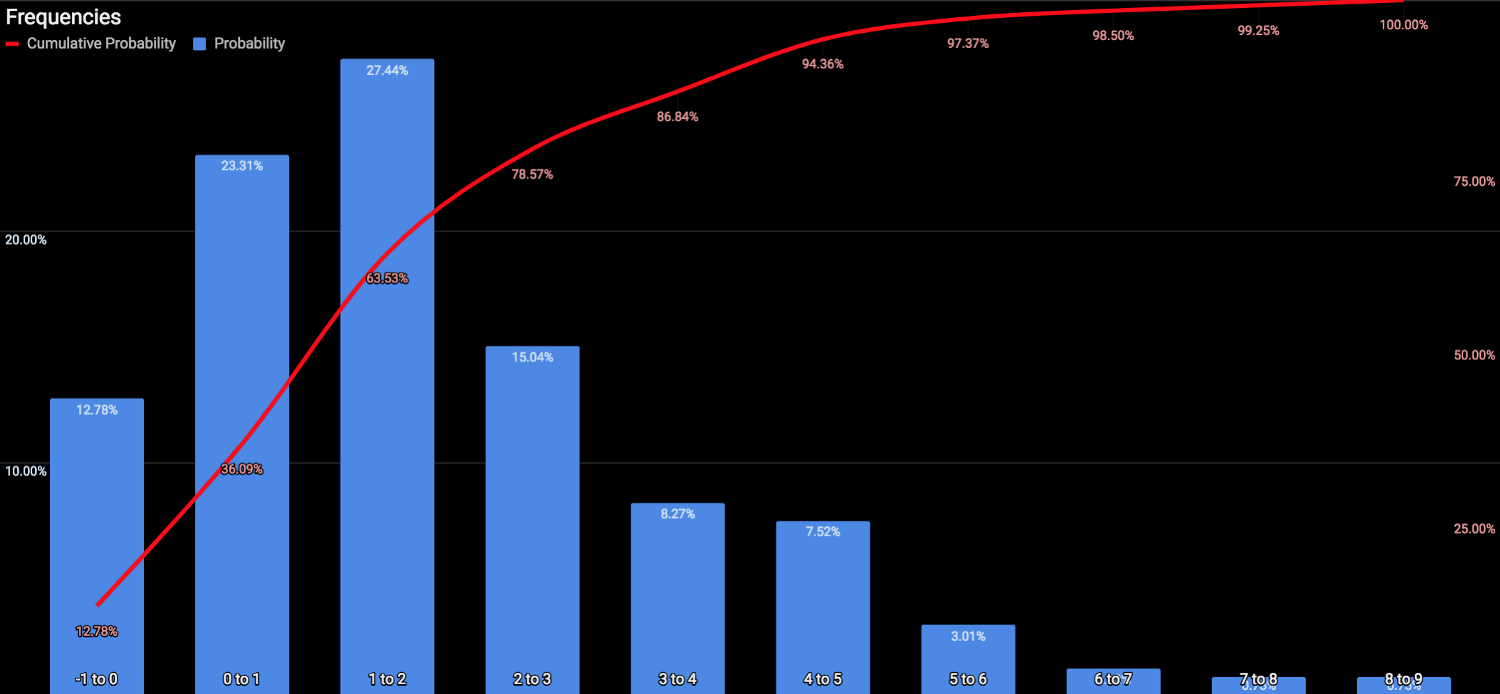
Weekly closes above z-score value of 5 occurred 5.64% of the time. Loosely speaking, a 94.36% chance of reversal can be attached to any observation above this value. Similarly, weekly closes below realized value occurred 12.78% of the time. Or from a historical perspective, expected to be above this zone 87.22% of the time. As we all know, history doesn’t repeat but it often rhymes. For example, in the next overvaluation cycle, the top may not exhibit a parabolic spike like in the past. This emphasizes the need to combine multiple sources of evidence to come to a sound conclusion and not rely on this metric alone. With that said, these observations add more confidence to the 4400–5000 region.
Furthermore, observing the log trend line in respect to realized value, one can see that price coincidentally bottomed at this zone twice. Currently, the trend line sits at 74B and is expected to rise to 88B by 1/6/19. This amounts to a rate of growth about 5.88% per month (compared to 10% four years ago). Since this trend line is increasing in value at a decreasing rate, its reasonable to expect that the market cycles may start to elongate to some degree. But thats a topic for another day.
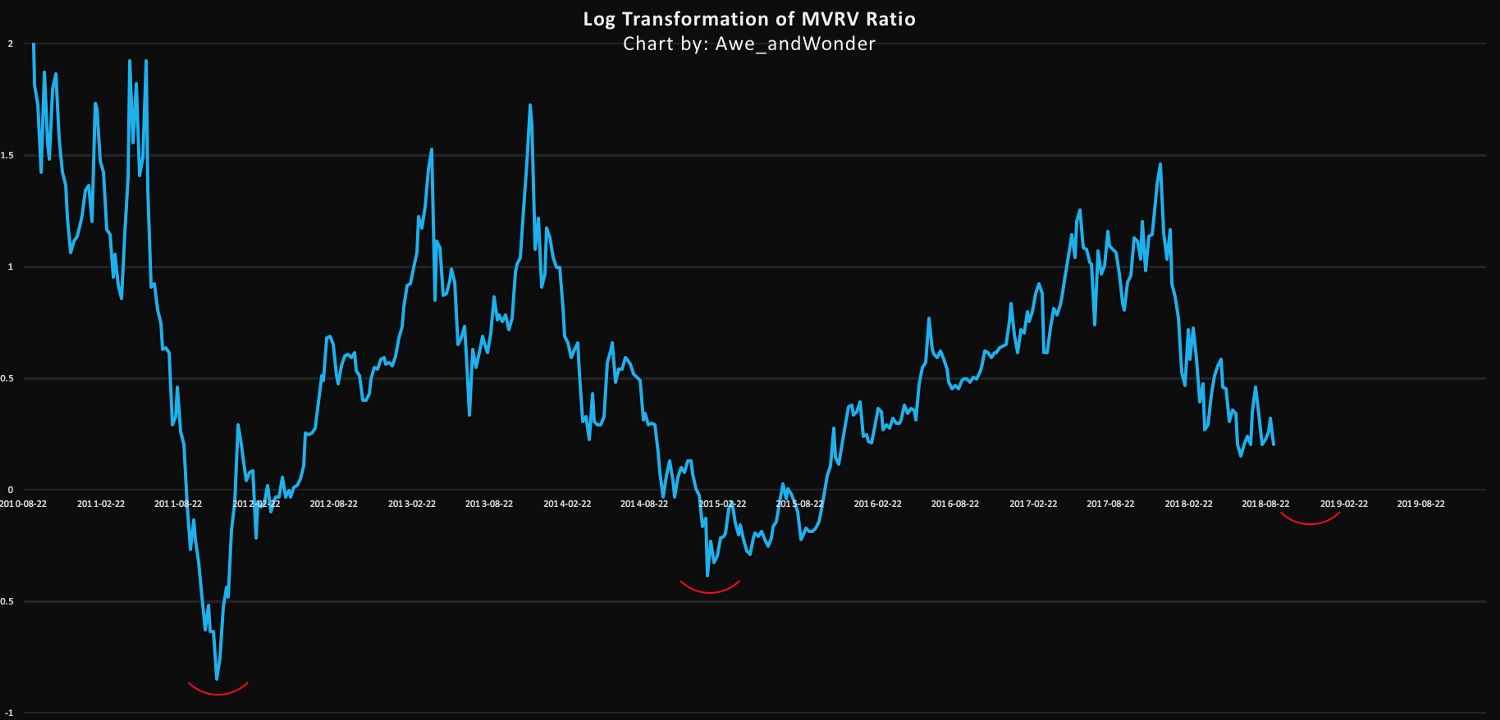 MVRV ratio emphasizing percentage change
The chart above represents the original MVRV ratio but with an applied log transformation to amplify visual clarity.
Note that the January 2015 bottom was 32% higher than 2011. Applying this same haircut, the estimated z-score deviation below realized value is 0 to -0.25.
This is perfectly reasonable. Markets stabilize though price and time. Considering the outsized returns of the 2017 bull market plus the parabolic blow off top that followed, it should be of no surprise that this market may need more time to stabilize and level off before the next bull run.
In conclusion, its important to remember that these type of models are only as good as the simplifications and assumptions they make, and that no metric should be used in isolation. The MVRV Z-Score metric from a historical perspective has worked incredibly well. I’d imagine combining this metric with exponential and logarithmic regression confidence intervals, to name a few, would make for a killer combination…
PS.
Thanks to Nic Carter and Antoine Le Calvez for providing the data.
Please follow if you’d like further analysis.