
Bitcoin Delta Capitalization
| If you find WORDS helpful, Bitcoin donations are unnecessary but appreciated. Our goal is to spread and preserve Bitcoin writings for future generations. Read more. | Make a Donation |
Bitcoin Delta Capitalization
A New View of BTC Long-Term Valuation
By David Puell
Posted February 14, 2019
Disclaimer: Nothing contained in this article should be considered as investment or trading advice.
As a follow-up to Willy Woo’s recently-introduced Bitcoin Valuations live chart, this article aims to present delta cap with the goal of answering two of the most pressing questions in speculators’ minds at the present moment:
- Where is the bottom?
- When is the next bull run coming along?
Something’s Amiss
Two sets of items originated the search for what later became delta cap:
- Awe and Wonder’s studies on Bitcoin’s logarithmic regression and Plan B’s studies on Bitcoin’s power regression (R² of 0.93 and 0.95 respectively), which seem to suggest that the BTC trend is increasing at a decreasing rate.
- Murad Mahmudov’s exploration of historical moving averages, expressing a dissatisfaction with any particular SMA or EMA as definitive enough to “catch the bottom” in every bear cycle.
This initiated the search for a metric that both adapted to Bitcoin’s rapid, high-velocity parabolic moves and accounted for its overall trend decay over time. Two other valuation models seemed to provide a tentative answer: realized cap for the former and average cap for the latter.
Delta Capitalization
Delta cap is, as seen next, a hybrid of sorts — half “fundamental,” half “technical.” It is calculated through the following formula, measuring the difference between two long-term Bitcoin moving averages:

For the purposes of this piece, let’s review these definitions:
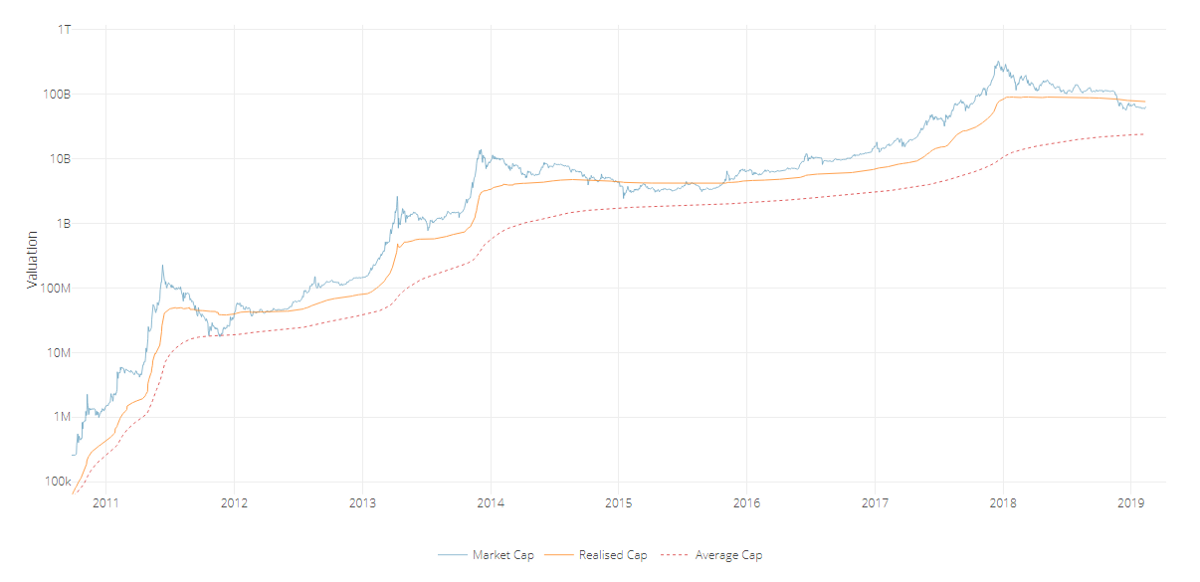
Realized capitalization
Invented and presented by the brilliant team at Coinmetrics, instead of counting all of the mined coins at current price, the coins are counted at the price when they last moved through the blockchain. This approximates the USD value paid for all the bitcoins in circulation. Best put by its co-creator Nic Carter, it can be described as an on-chain volume-weighted average price (VWAP) of BTC.
Average capitalization
Instead of setting a fixed period for calculating a moving average (e.g., a 200-day MA), this is a life-to-date, cumulative simple moving average that serves as the true mean of the whole history of market cap. Due to its “laggy” nature, it is the perfect mechanism to help decay the upward speed of delta cap over time. Shoutout to Renato Shirakashi for first pointing out this average.
Below, a view of both lines, courtesy of Willy Woo:
The aforementioned substraction of the two in turn provides the following delta cap line, both reactive locally and decaying globally:
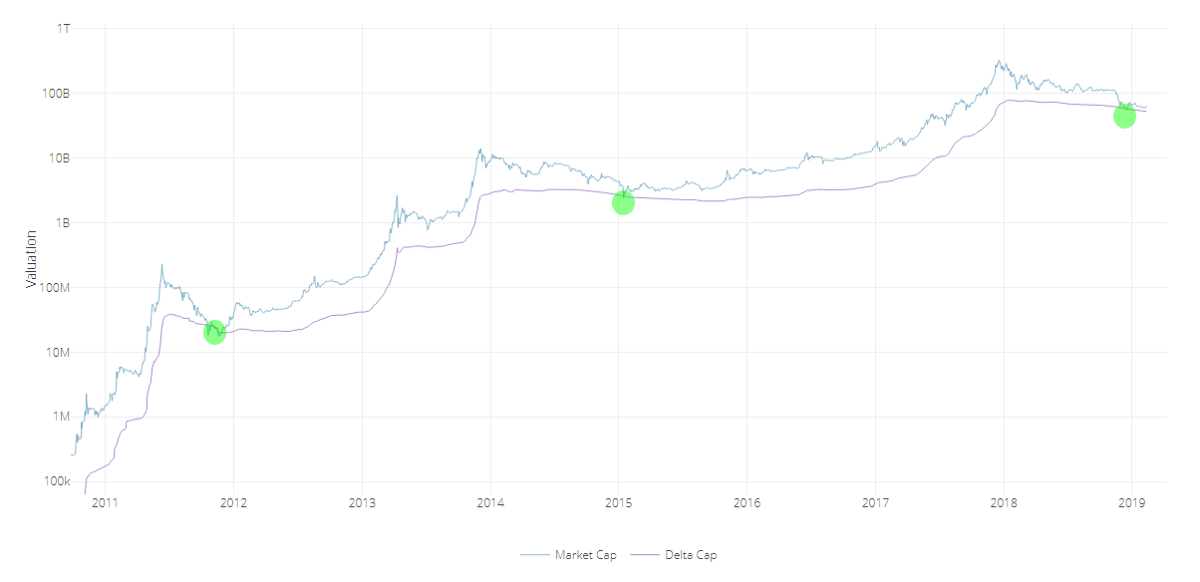
As seen at first glance, delta cap provides an excellent framework for catching global bottoms — or at the very least bottoms near the floor of the bear cycle. Please see the caveats of this indicator below to have a more nuanced view of the current state of affairs, since having just touched delta cap does not guarantee that we have bottomed.
Time Analysis
Another interesting (and still experimental) exploration of delta cap emerges when comparing it to its parent inputs through a logarithmic view, as follows:
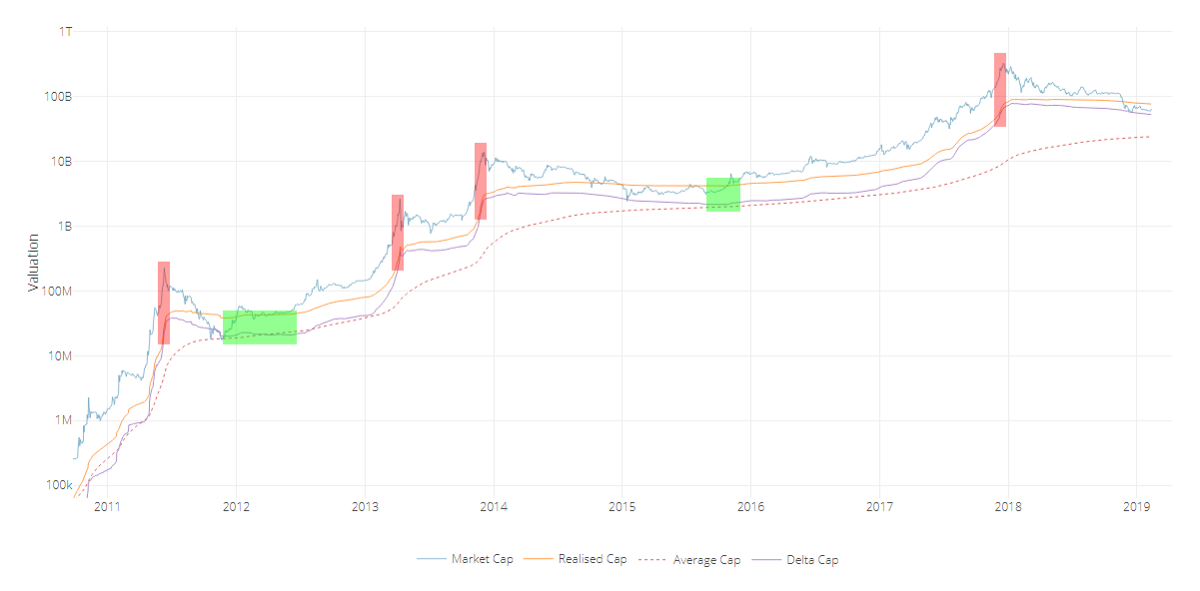
We can easily gauge periods were delta approaches realized cap during the bubble tops, and then evermore slowly descends to almost touching the average cap during the phases of breakout price behavior, signaling the inauguration of the new bull run.
The good news? If this pattern continues, people will have lots of time to buy up. The bad news? This bear-to-sideways market may last for an unprecedented while, going as far as projecting a post-accumulation breakout as late as Q2, 2020 — the moment when it could be expected for delta cap to get nearest to average cap if the extension of these lines continues as-is. Bear in mind that this is all pending on the overall rate of drop of realized cap and the rate of rise of average cap — local price action, velocity, and dormancy are all in play. Time domain here is still a broad estimate.
It goes without saying that we lack enough bottom samples to claim this as a certainty, but long-term investors must stay mentally prepared for this possible delay. It is further evidence that suggests Bitcoin’s cycles are elongating.
Yes, Another Ratio: MVDV
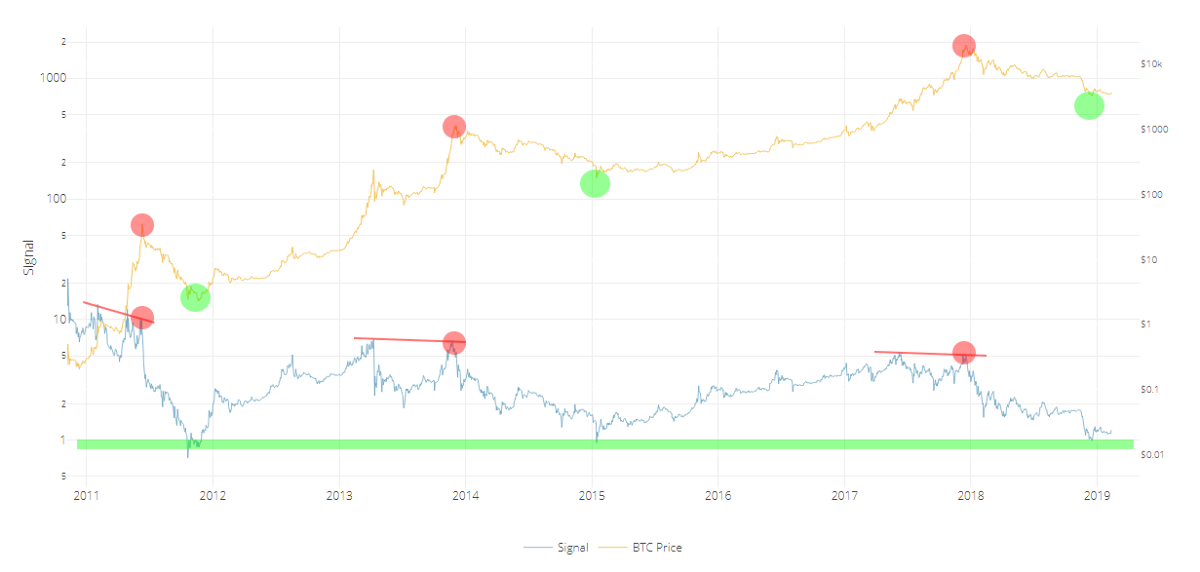
Since most will be curious about how the Market-Value-to-Delta-Value (MVDV) Ratio looks like, here it goes:
A few notes on it:
- Just as seen on MVRV Ratio and the Mayer Multiple, MVDV seems to indicate that each of Bitcoin’s blow-off tops is losing momentum. This is not necessarily bearish, as I believe it merely implies that each bubble is becoming less exuberant and getting closer to the mean.
- Major bearish divergences seem to announce global tops (red circles) while differentiating them from previous local tops of the same cycle.
- The bottoms seem to maintain a steadier horizontal longitudinal threshold at 1 (green line). If market cap were to revisit delta cap today at a lower low, the oscillator would present this event as a double bottom.
Caveats
- _Having touched delta cap recently does not imply a global bottom:_One must remember that delta cap is currently sloping down — and it will continue to do so for several months — so the likelihood of market cap revisiting it is not out of the question. Add to that the fact that the NVT tools are still just slowly trending into normal historical conditions and velocity remains weak. Touching delta cap on a lower low in the following months is still a likely possibility. Every penetration of market cap into delta cap should be best used as one componet of an averaging-in strategy over a prolonged period of time.
- Despite timeboxed halving days, the Bitcoin cycle seems to be elongating: This makes perfect sense, since larger bull runs require larger liquidity. The experiment here is to continue evaluating delta cap as a mean that keeps adjusting to Bitcoin’s curved trend. That being said, the time analysis section of this article remains highly speculative, especially for signaling the breakout events, so let’s take it one day at a time.
- _The market currently holds a major dissonance:_That of delta cap providing a good “baseline” for a relatively optimistic market floor, versus the current state of velocity as seen on NVT Ratio,Network Momentum, and NVT Caps— on life support relative to price.
- Delta cap remains experimental: Just as with most technical and on-chain tools, these indicators should be used with prudence and in the company of other trading mechanisms and a sound risk management strategy. Past events don’t reflect future outcomes.
Acknowledgements
Many thanks to the following individuals:
- Willy Woo, for the beautiful charts and valuable feedback.
- Murad Mahmudov,Phil Bonello,Hans Hauge,PositiveCrypto, and Plan B, whose comments helped perfect this article.
Sources
- Woobull.com : Charts and early market cap data archeology.
- Coinmetrics.io : Realized cap data.
- Blockchain.com : Market cap data.
Author
David Puell, Head of Research @ Adaptive Capital