
When did Bitcoin’s investment era begin? A study using NVT.
| If you find WORDS helpful, Bitcoin donations are unnecessary but appreciated. Our goal is to spread and preserve Bitcoin writings for future generations. Read more. | Make a Donation |
When did Bitcoin’s investment era begin? A study using NVT
By Willy Woo
Posted April 13, 2019
For those familiar with NVT Ratio, the data from the early years comes off very skewed, sometimes written off as noisy rubbish data.
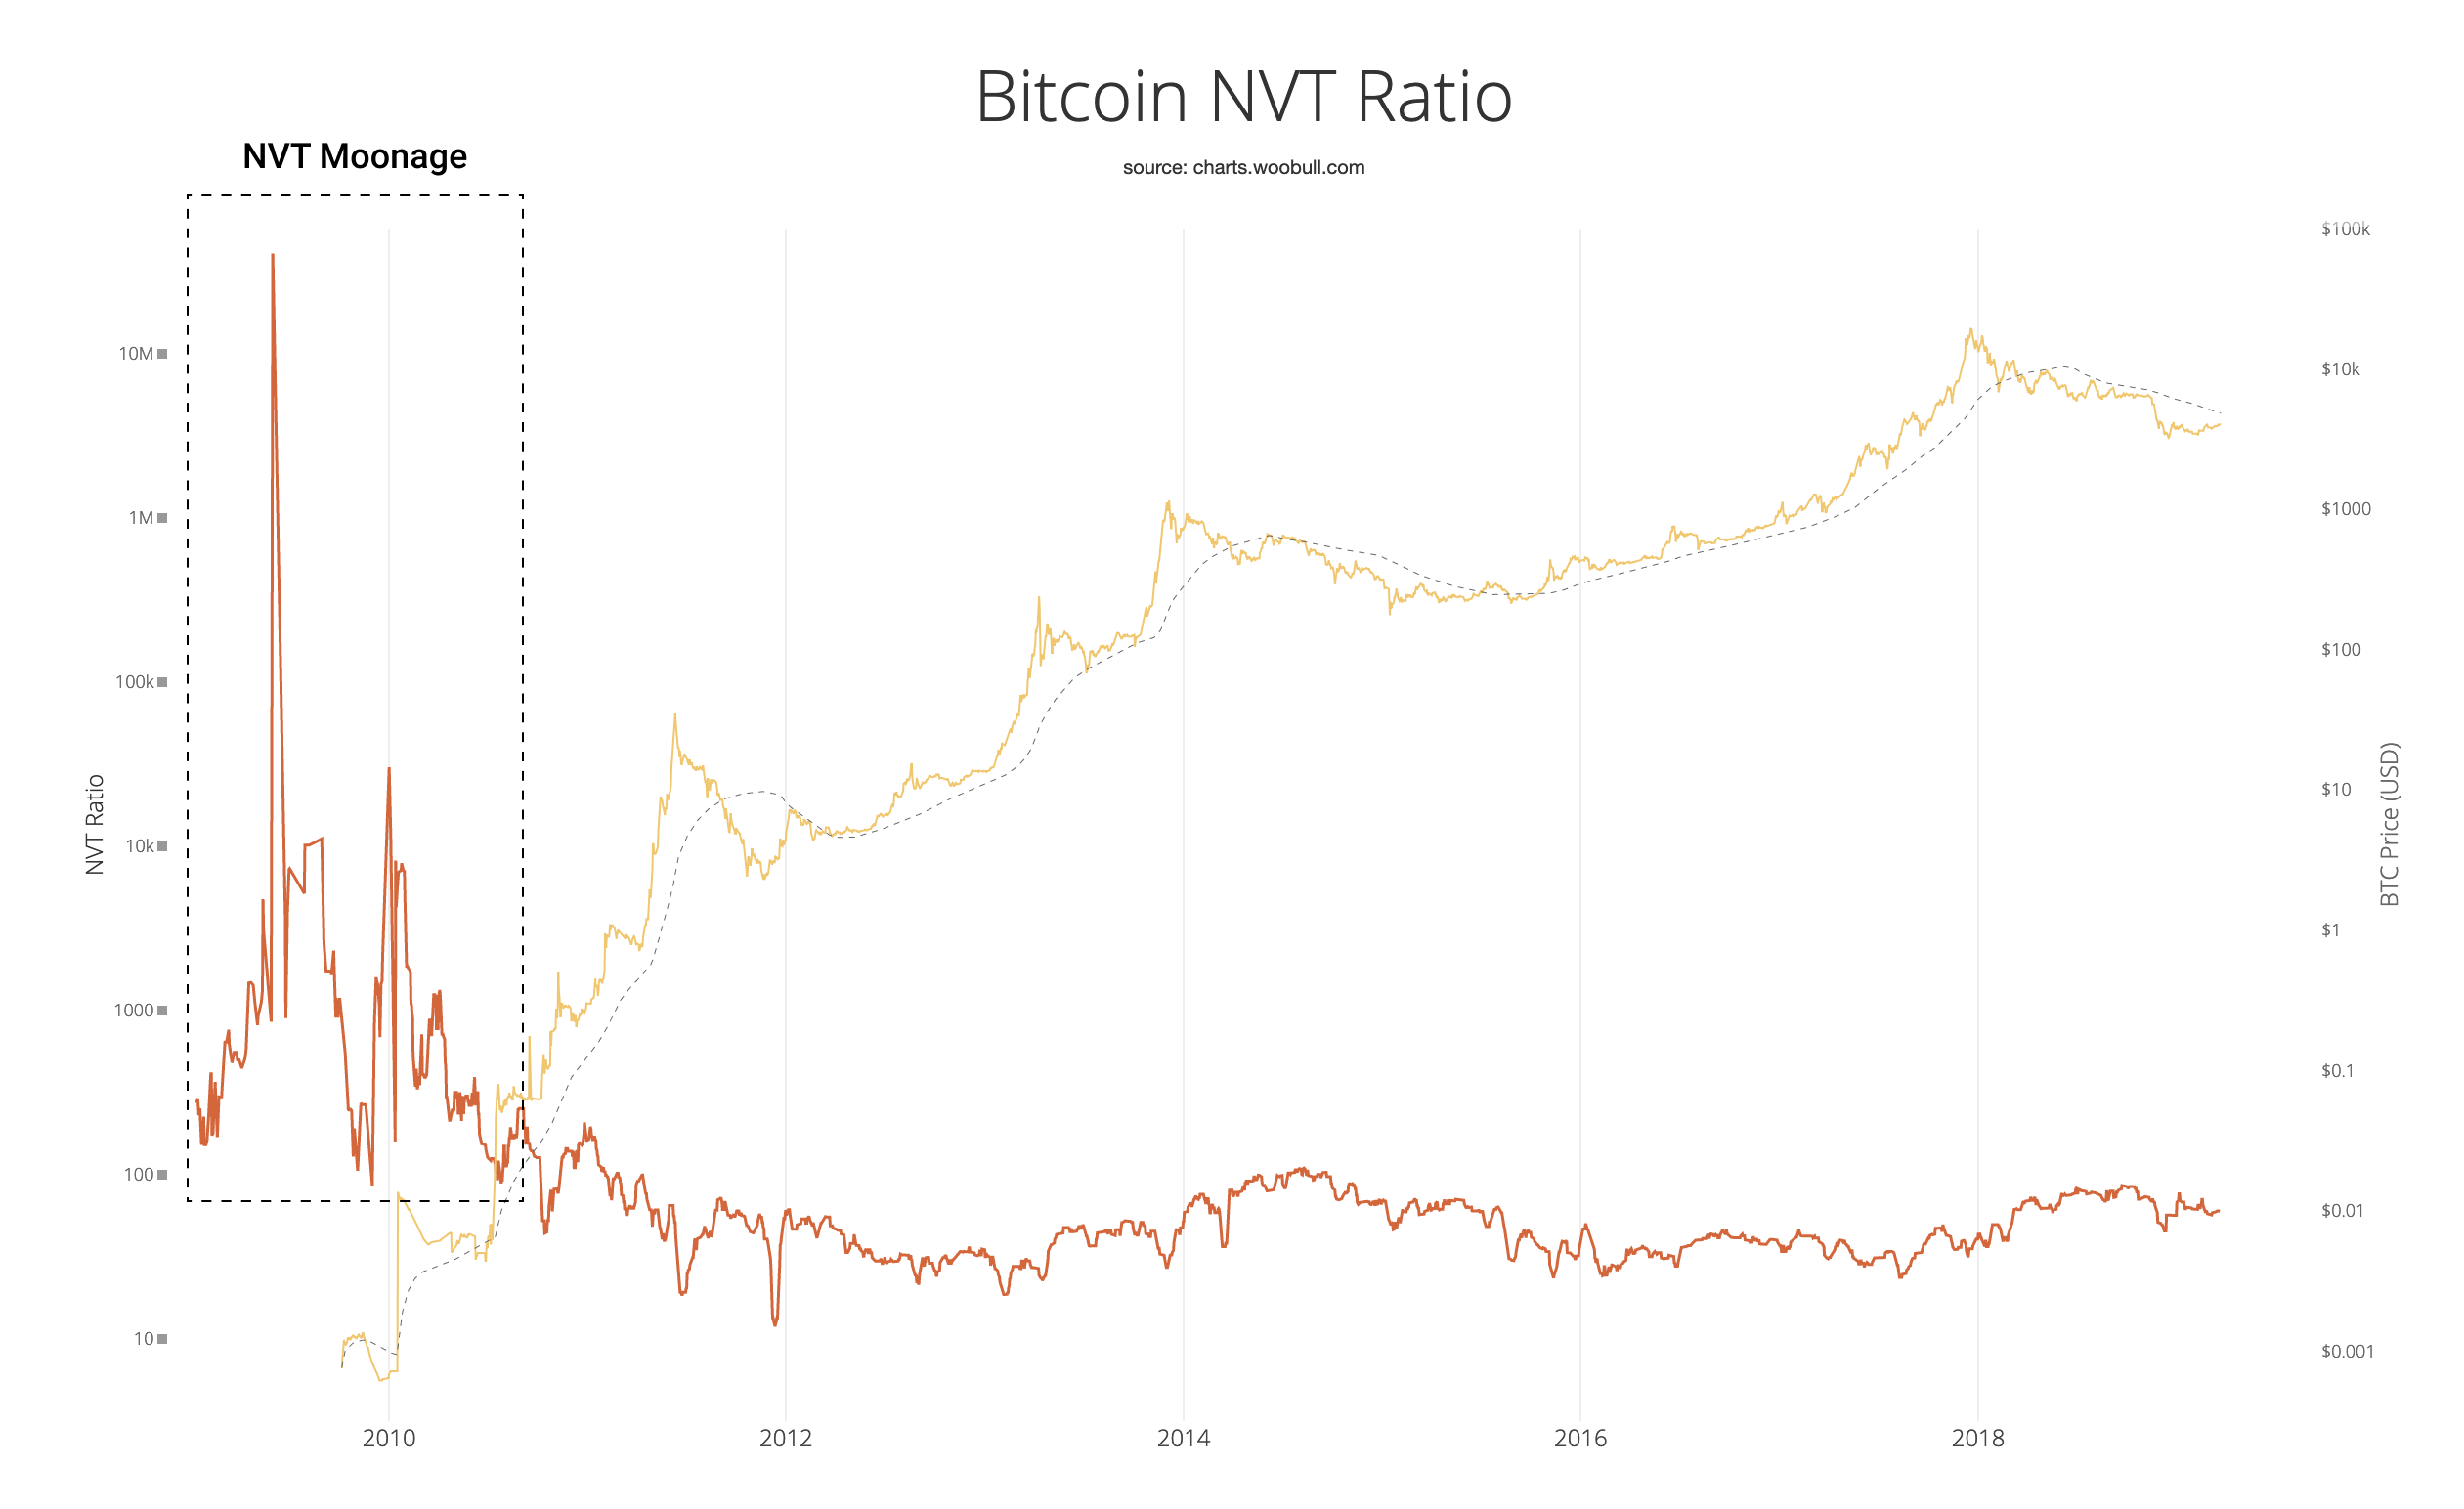
To answer the mystery of early NVT moonage, come with me on a trip down memory lane and visit the transactional data of Bitcoin’s early years.
How Bitcoin transactions work
First on our journey we must understand how a Bitcoin transactions work…
All transactions on the network consists of shards of BTC value (called UXTOs) moving between wallets. This is what a typical transaction might look like…

In this example, a 0.75BTC shard was sent to a recipient, and importantly there was a new 0.25BTC shard returning to the sender as the change from the transaction. In this common example the transaction had two output shards.
When sending to others we usually see 2 or more outputs due to the change output returning. (Sometimes there are a multitude of outputs, especially if payments are made to many recipients in the same transaction, Bitcoin exchanges like to do this for efficiency.)
Another common thing we do is cleaning out a wallet, sending all coins to a new wallet. This is a common example of a single output transaction.

Now here’s a special case…

This transaction has no inputs, and one output. This happens when a new coin is mined into existence, we call this a coinbase transaction .
Great, after that primer we we can revisit Bitcoin, the early years…
The early investment market
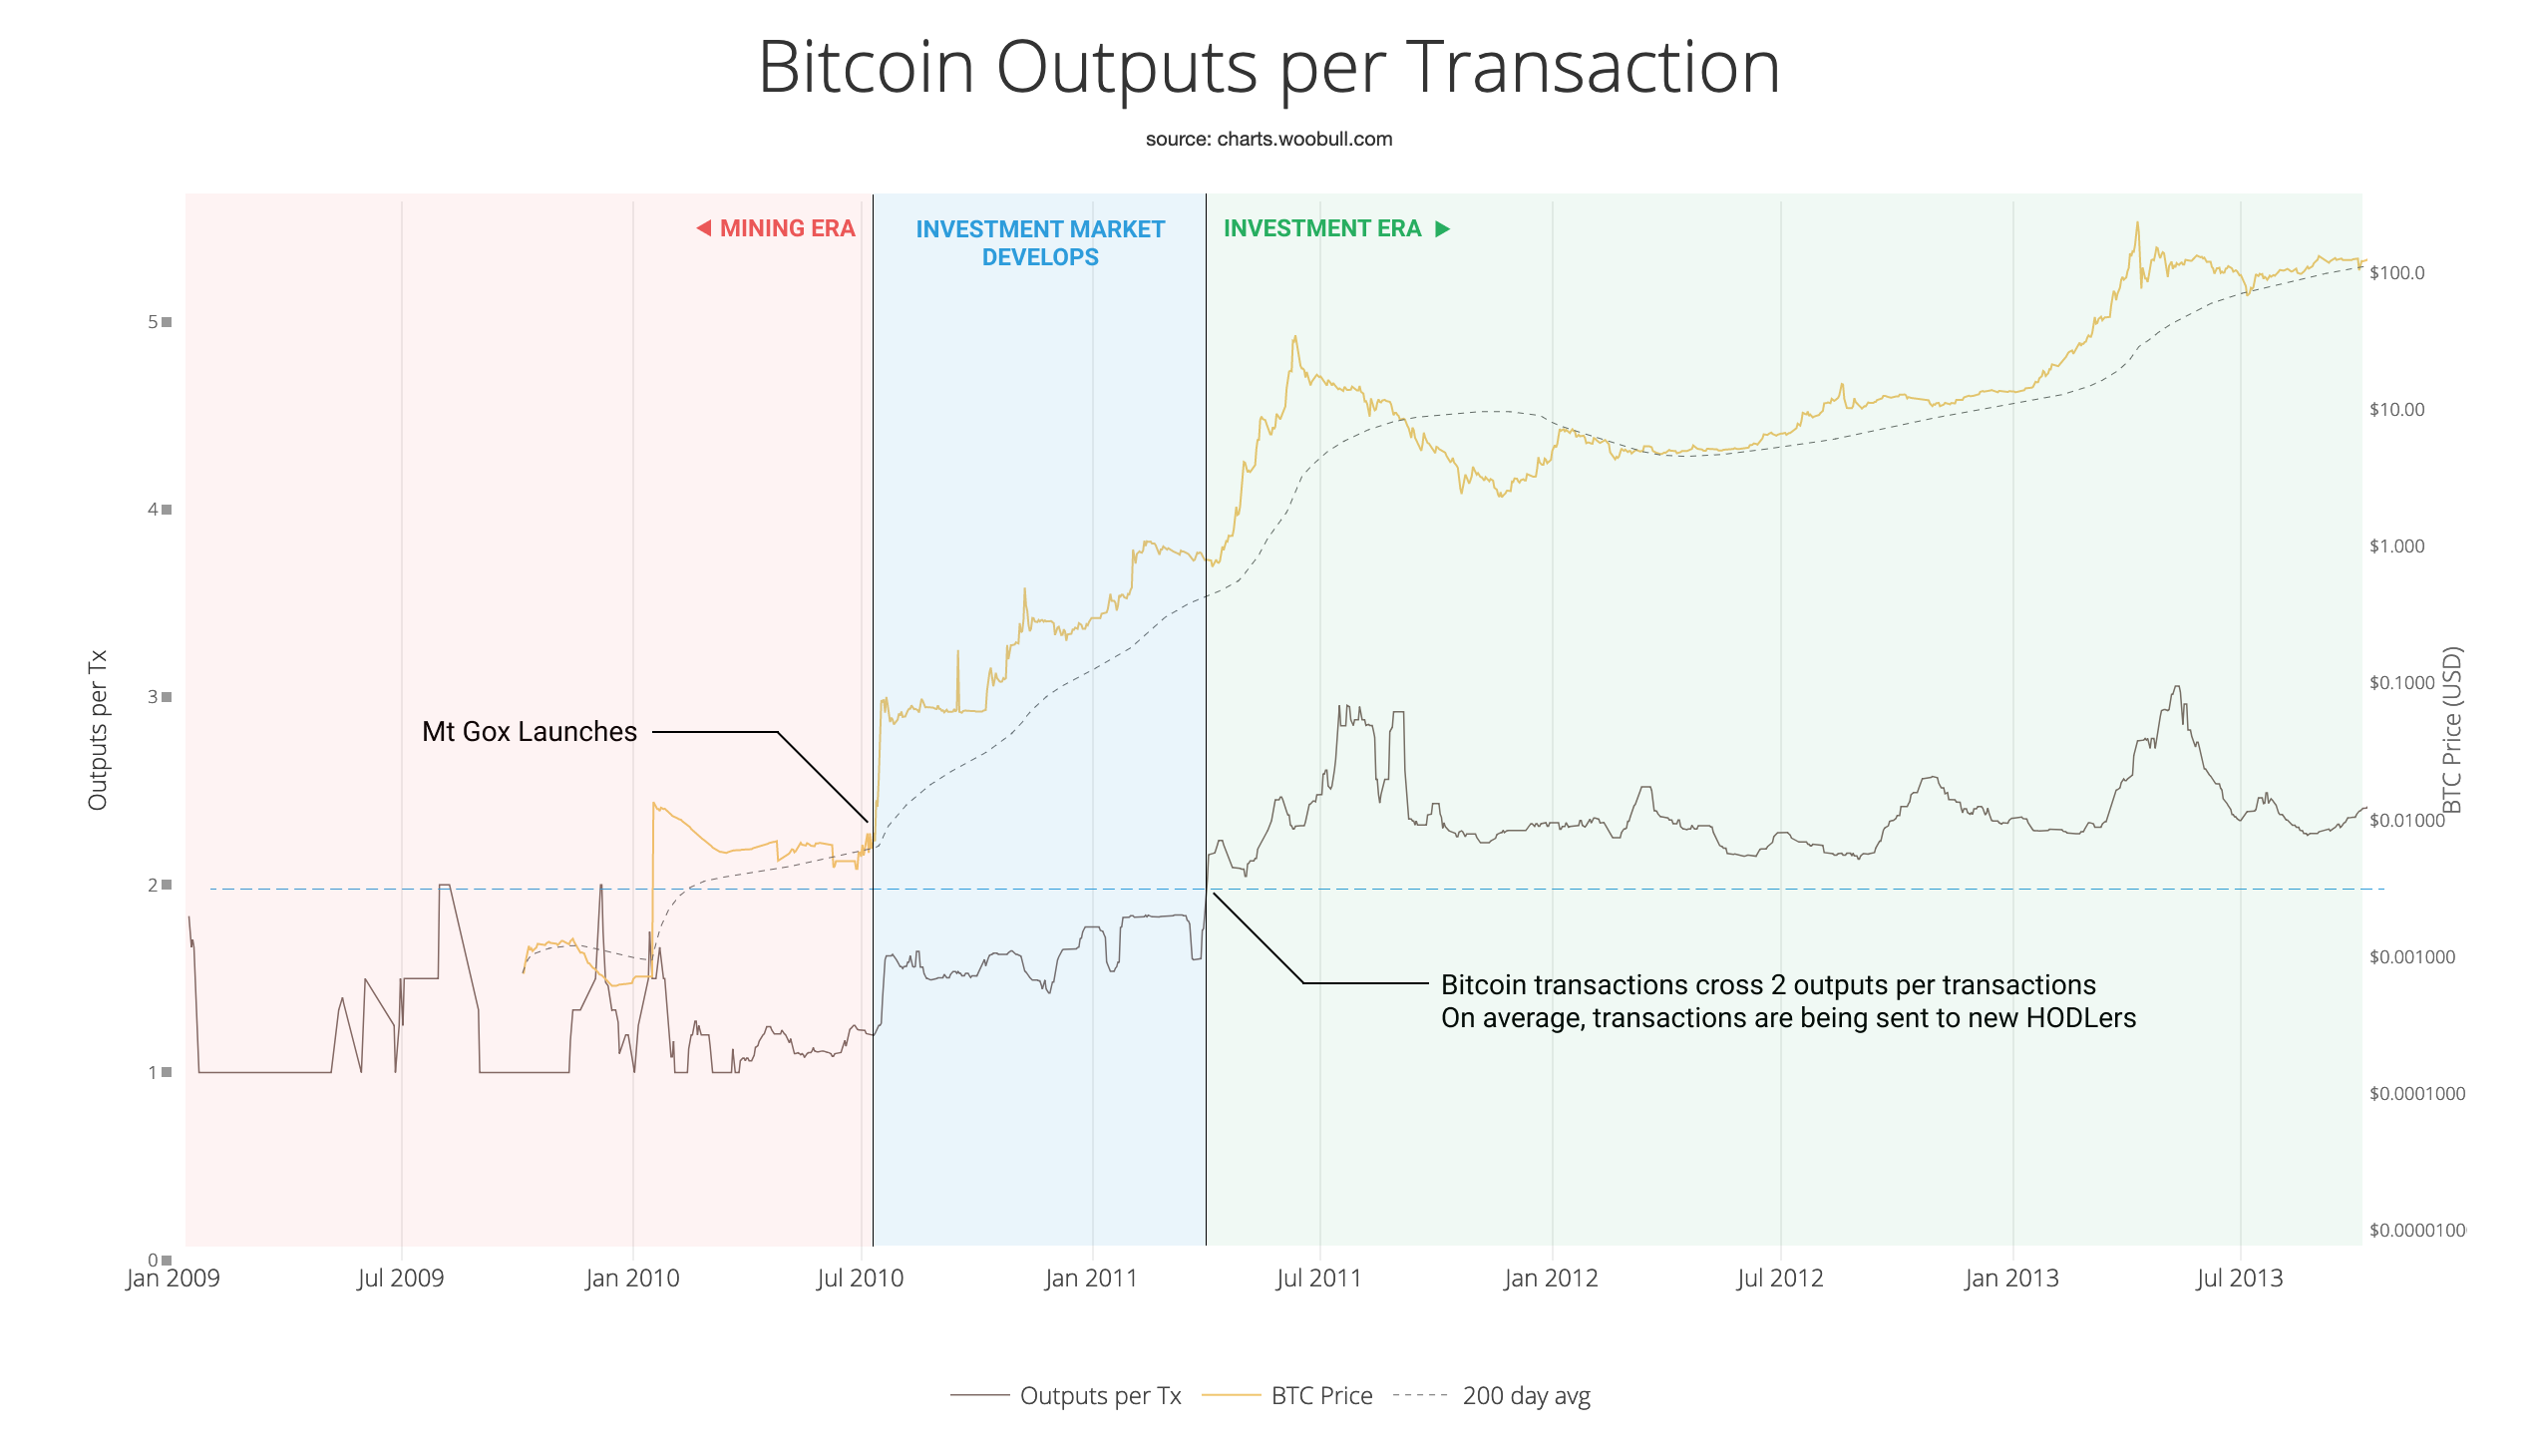
In the early era, the network was dominated by mining. Coins were either mined straight into wallets and held, or moved from one wallet to another. We can see this because the average outputs hovered around 1.
On 5th October 2009, a website called New Liberty Standard started pricing bitcoins using the price of electricity it took to mine them. This was the first time Bitcoin had a daily price.
By 16th January 2010, New Liberty Standard started pricing according to buy and sell demand, and the price jumped 19x from 0.07 cents to 1.3 cents.
On 25th May 2010, a second market opened called Bitcoin Market. It also traded according to buy and sell demand. (Its first day of trade had a close price of 0.3 cents with a volume of 1000 BTC, that’s $3 of trade volume.)
The third exchange to open was the infamous MtGox, launching one month later in July 2010. It’s here we see the price leap again, and the average outputs per transactions start to climb towards 2, this is where the early investment market starts to develop. Average outputs climbing to 2 was the telltale sign that transactions between investors were outnumbering those from mining.
Breaking down the early market under the lens of NVT
Now we can move onto the NVT domain and look at the actions the market took in its early history. Here’s the NVT Ratio chart using the latest volume estimates from Coin Metrics Pro.
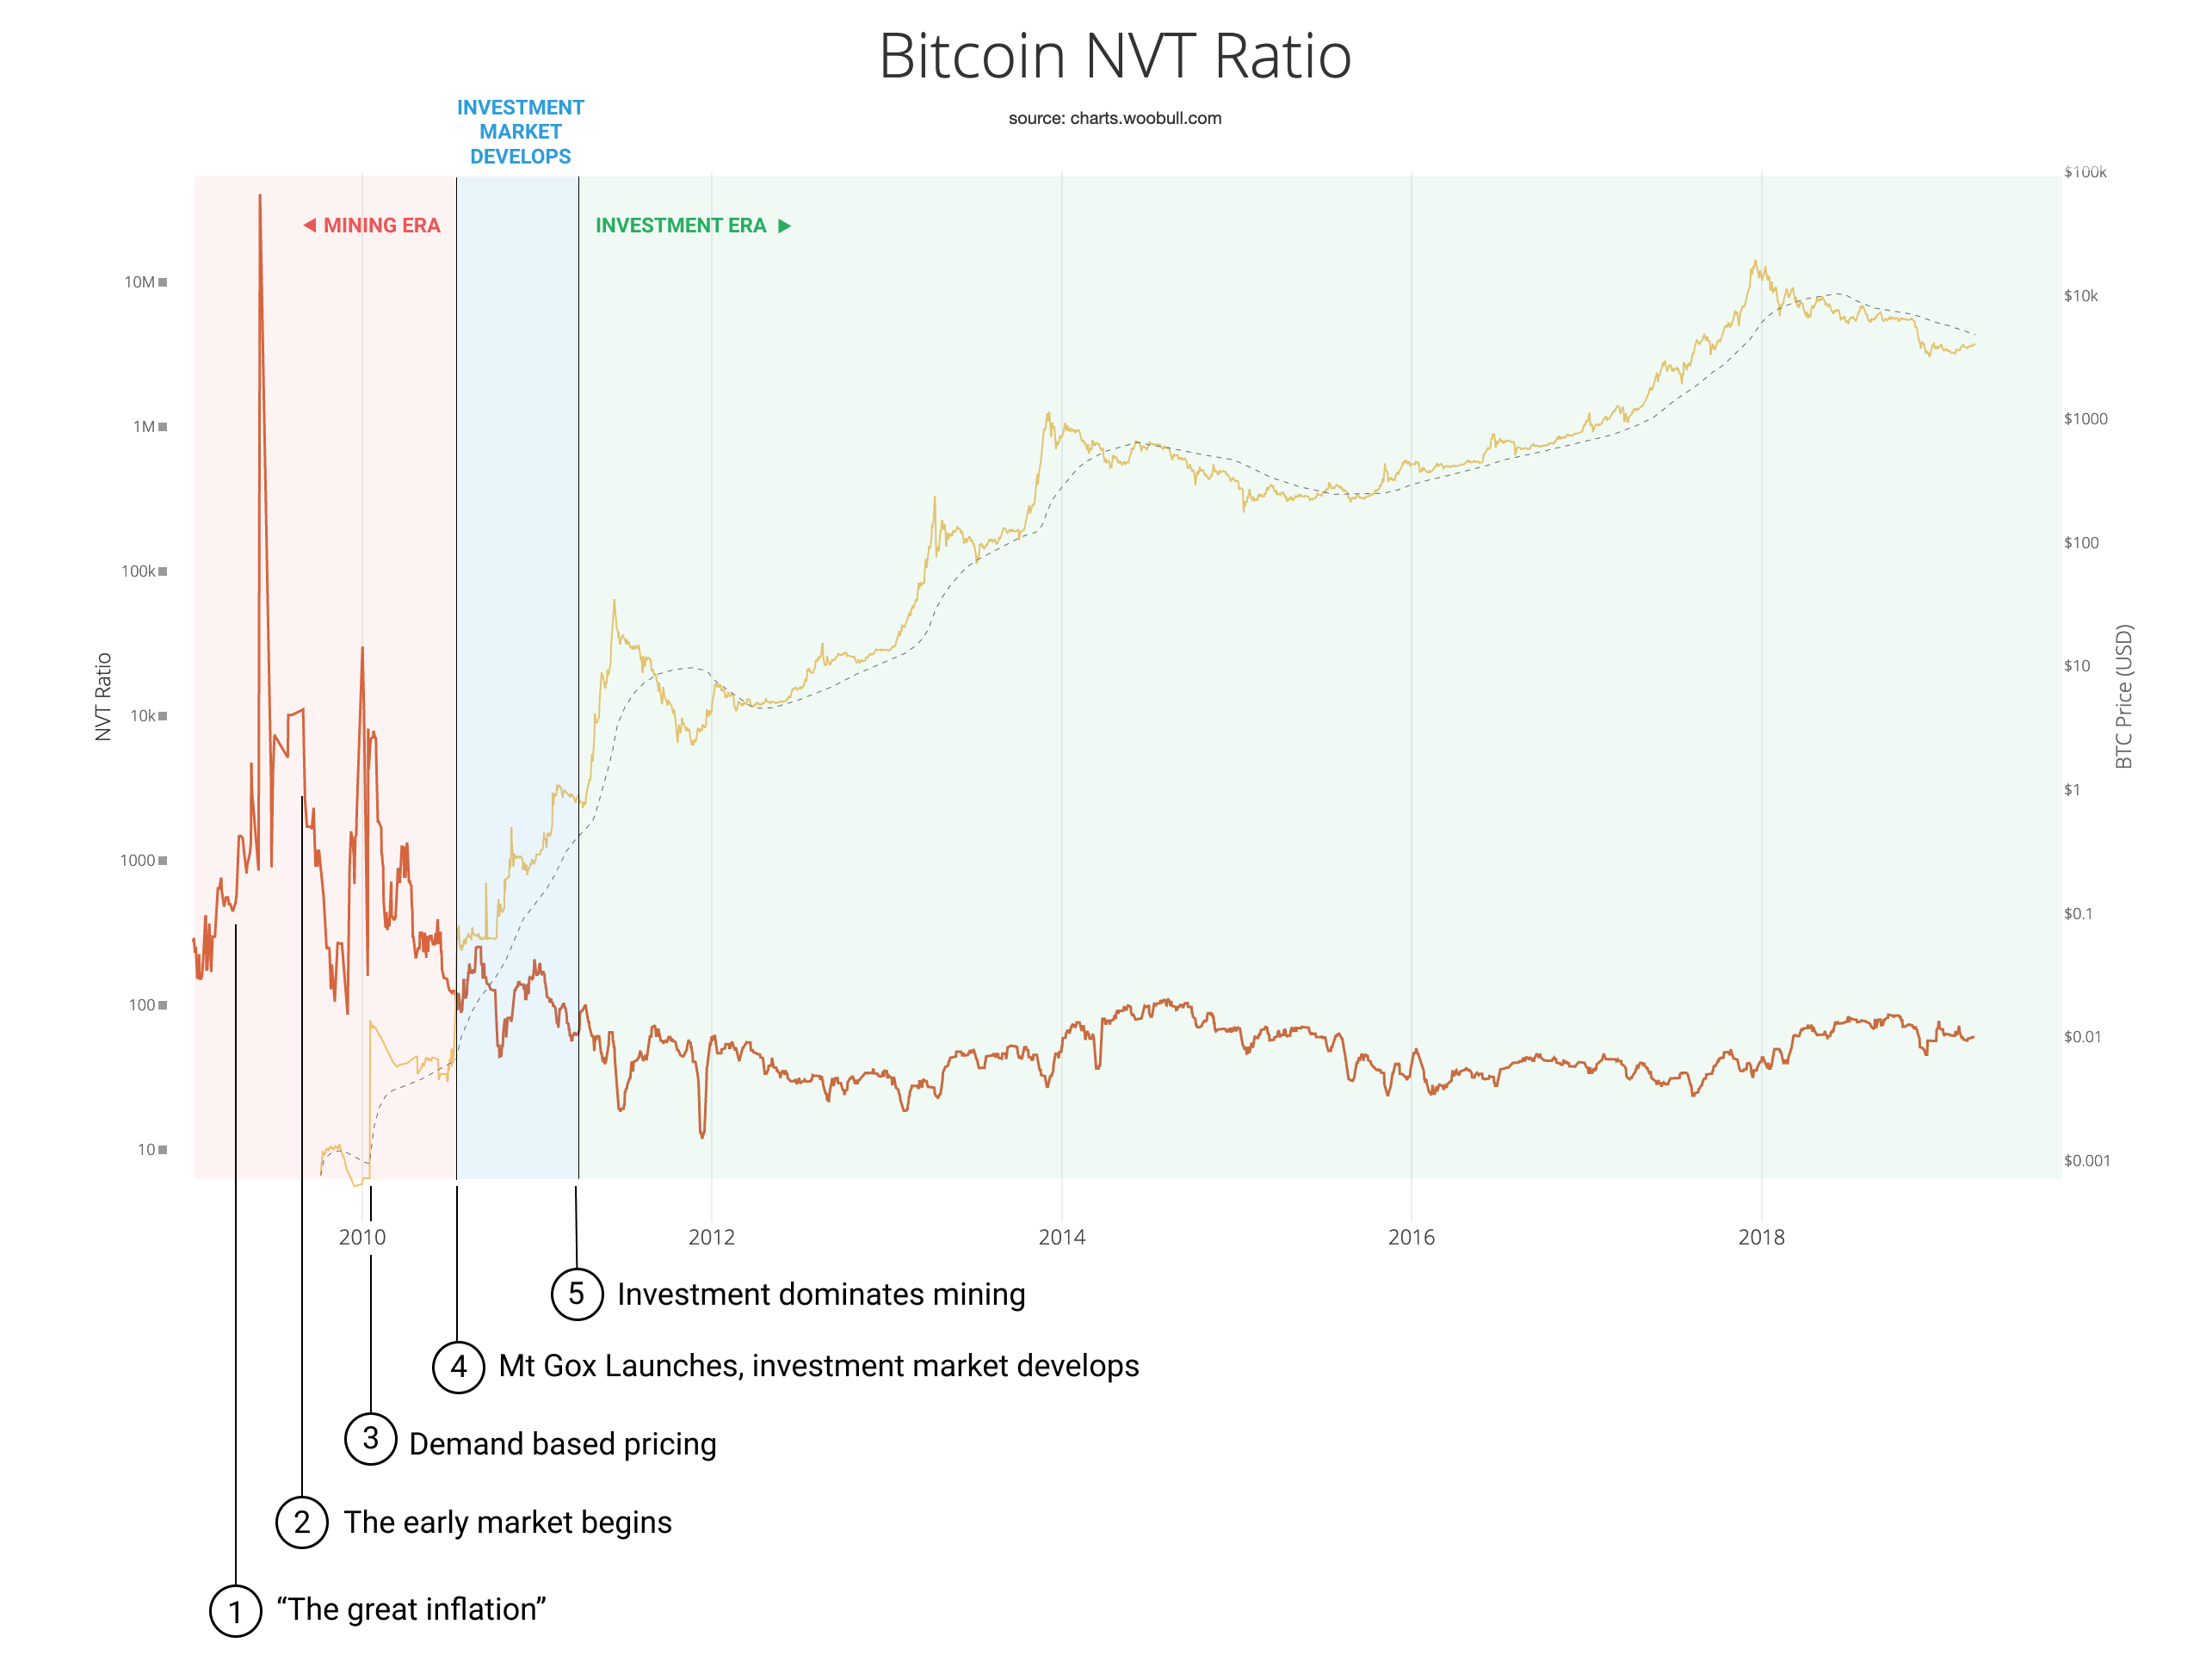
Breaking this down:
- The Great Inflation. This is the period where the sheer volume of new coins arriving via coinbase transactions meant the value flowing on the blockchain was high in comparison to the money supply. (NVT Ratio by definition is the ratio of the money supply to the coins flowing on-chain). As the money supply increased the impact of the coinbase transactions got diluted and you can see the NVT Ratio climbing steeply as the ratio of money supply outstrips the new coins moving into existence.
- The early market begins. In June 2009 interestingly before even the first prices of BTC was published by New Liberty Standard, we see activity between different HODLers, likely OTC trades. Enough coins move on-chain to bring NVT Ratio downwards over time, we can also confirm this as a blip on the outputs per transaction chart further above. (One could suggest this was also testing by early supporters of the network, but the volumes and time period of sustained activity look too consistent and high for this to be a viable reason in my opinion).
- Demand based pricing. When New Liberty Standard introduces their demand based pricing we see an immediate increase in NVT, the flows of coins between HODLers dry up as price jumps 19x. We also see the market adapt to the new prices and on-chain flows between investors start to increase again, we see NVT dropping.
- MtGox launches. With the advent of MtGox which immediately became popular, we see further drives of on-chain volume (as a percentage to the supply) to the normal zone we typically see in the Bitcoin investment era.
- Investment dominates mining. As early as April 2011, investment flows mature into the same kind of ratios we see today. NVT comes into the normal band which we’ve seen for the last 8 years.