Transaction count is an inferior measure
Transaction count is an inferior measure
By Nic Carter
Posted November 10, 2018
It is popular to measure Bitcoin by looking at its daily transaction count or ‘tps’ — transactions per second. New blockchains often advertise tps rates in the millions or billions and sneer at Bitcoin’s measly 3 - 4 tps rate (it fluctuates between 200,000 and 350,000 transactions per day).
But this is an incomplete picture. There are at least three important variables to consider when holistically appraising a value transfer system, and the transaction rate is just one of them:
- Transaction capacity (tps)
- Typical transaction characteristics (transaction size)
- Settlement assurances
Together, transaction rate and average transaction size give you the economic throughput of the system; a measure of its financial bandwidth per unit of time. The settlement assurances tell you what sort of a system it is. How certain are you that you won’t face a chargeback or be defrauded? Does your transaction settle immediately, like physical cash? Or is there a 90-day chargeback period prior to settlement, as with most credit cards?
Even though Bitcoin is virtual, it is closer to a physical settlements system than a deferred-settlement system like credit cards. Bitcoins are virtual bearer instruments: if you possess the private key which unlocks an unspent output, you are the owner of those coins and entitled to do with them whatever you like. That asset is no one’s liability. In this respect, it more closely resembles physical cash or a commodity like gold. There is no recourse if you lose your coins or send them to the wrong address. Of course, recourse has its advantages in certain contexts; and the overhead for dealing with reversed transactions and fraud is exactly why credit fees exist. The costs of credit fraud and the remediation infrastructure are passed on to end users in the form of merchant fees. That’s why you can’t typically do a credit transaction for less than a dollar or two.
So how do you consistently compare dissimilar value-transfer systems like Bitcoin, Paypal, Visa, SWIFT, and physical cash? I’d recommend broadening your focus beyond simple transaction count. That’s only one component of economic throughput.
The chart below shows an idealized comparison of various value transfer systems along the axes of transaction count and typical transaction size. To simplify, payment networks consist of many small transactions, whereas settlement networks will exhibit fewer, but larger transactions (in dollar terms).
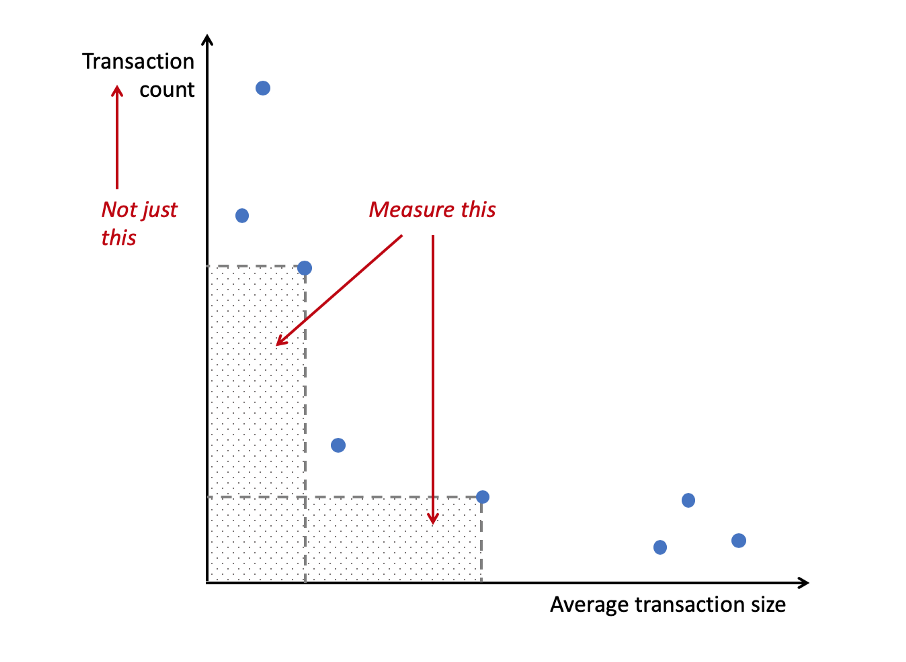
What we should really be interested in is the area under each point: that’s average transaction size * the number of transactions, which gives us the value flowing through the system per unit of time.
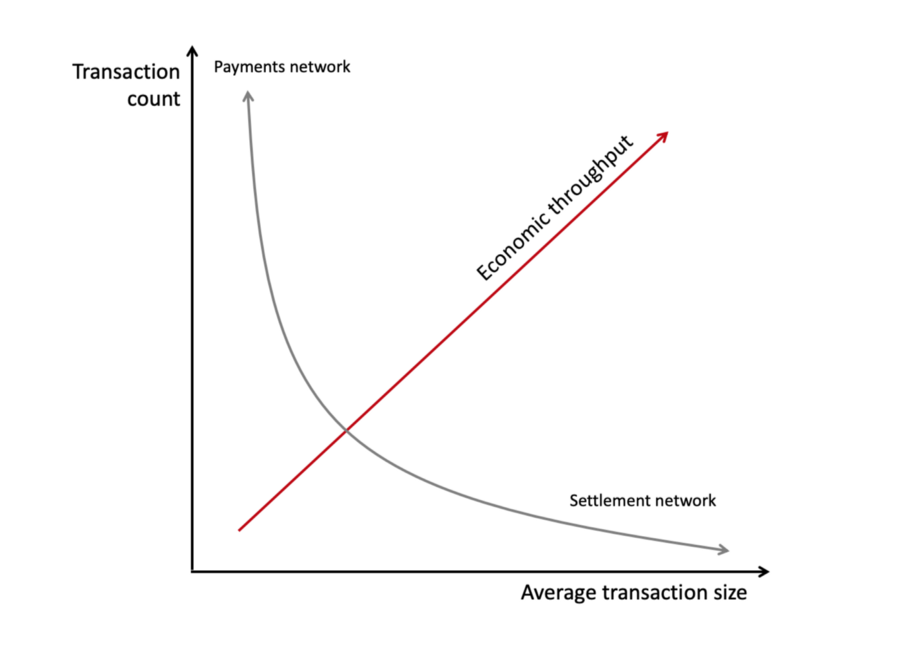
To further simplify, what you find if you aggregate data from a variety of networks is that they tend to cluster at one end or the other.
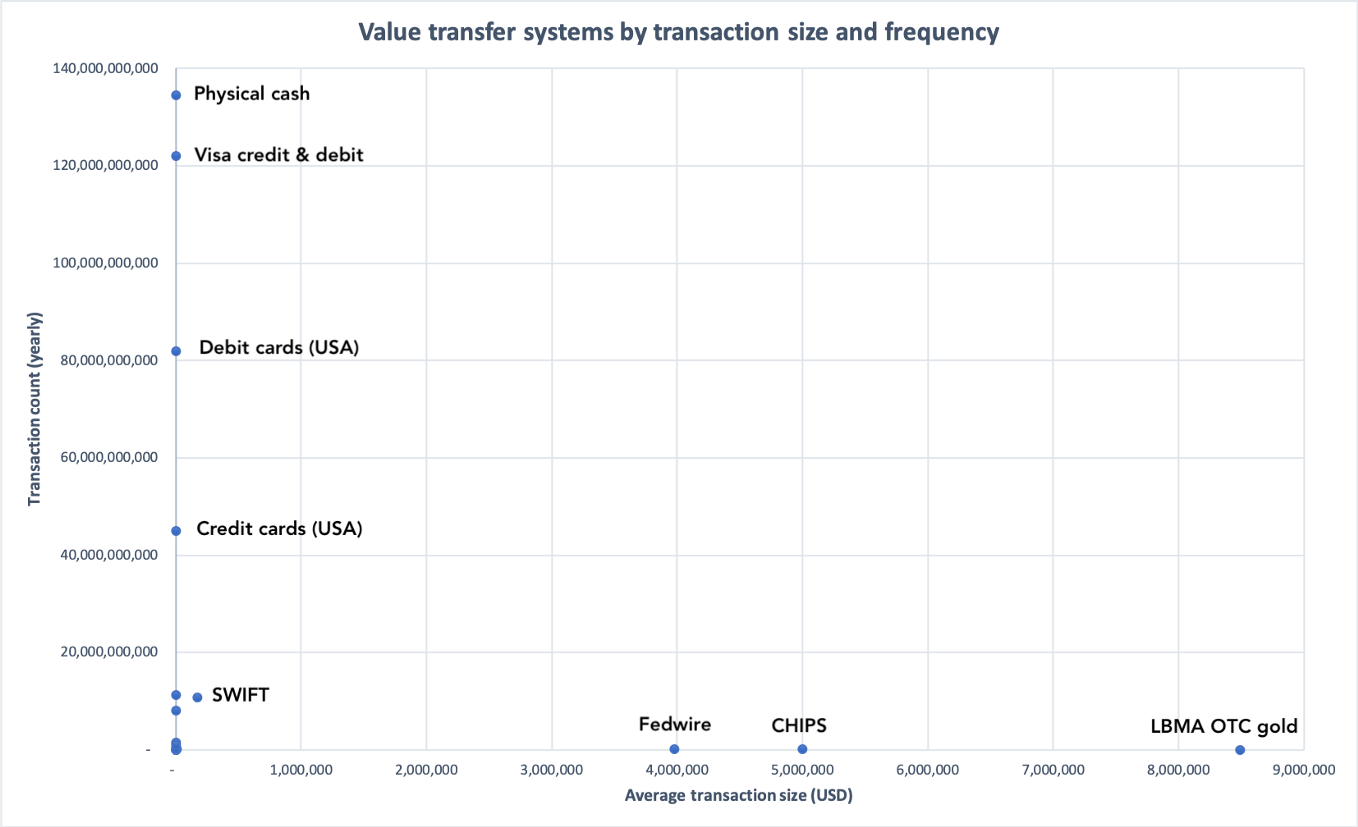
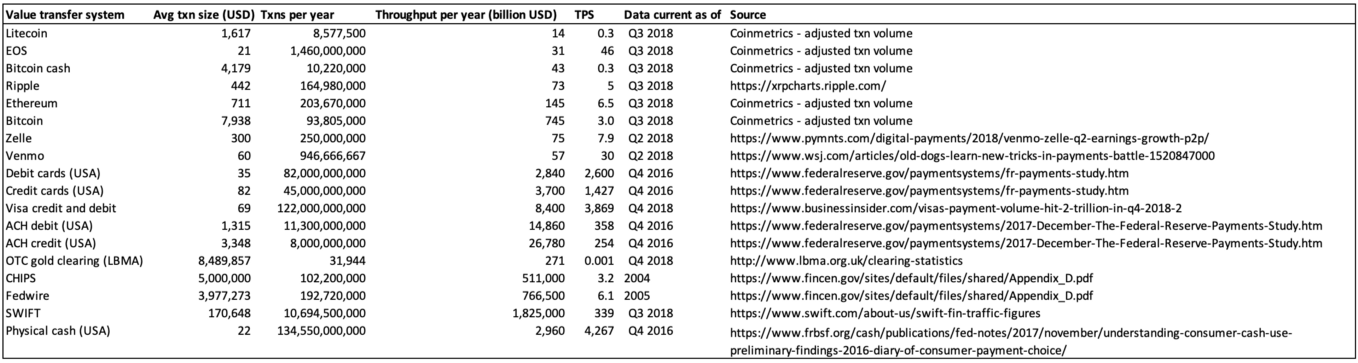
I’m oversimplifying of course, but you get the idea. Let’s plug some real numbers into the idealized model. I went ahead and found data for physical cash transactions, credit/debit transactions, mobile p2p payments, various popular cryptocurrencies, gold settlements, and various settlement and financial infrastructure systems (ACH, Fedwire, CHIPS, SWIFT).
The real numbers chart looks like an even more exaggerated version of the L in my toy model, because the systems vary on many orders of magnitude along the two axes.
 Sources in appendix
On the top left, you have physical cash and Visa credit/debit transactions, which have extremely high volume and smallish per-transaction sizes. On the bottom right, you have the massive settlement networks, with the gold settlements on the London market taking the crown for per-transaction size. One caveat: SWIFT is a messaging service, so value does not really flow through the system. The numbers listed for SWIFT are mostly academic in nature.
Let’s take the log view so we can cram everything in there.
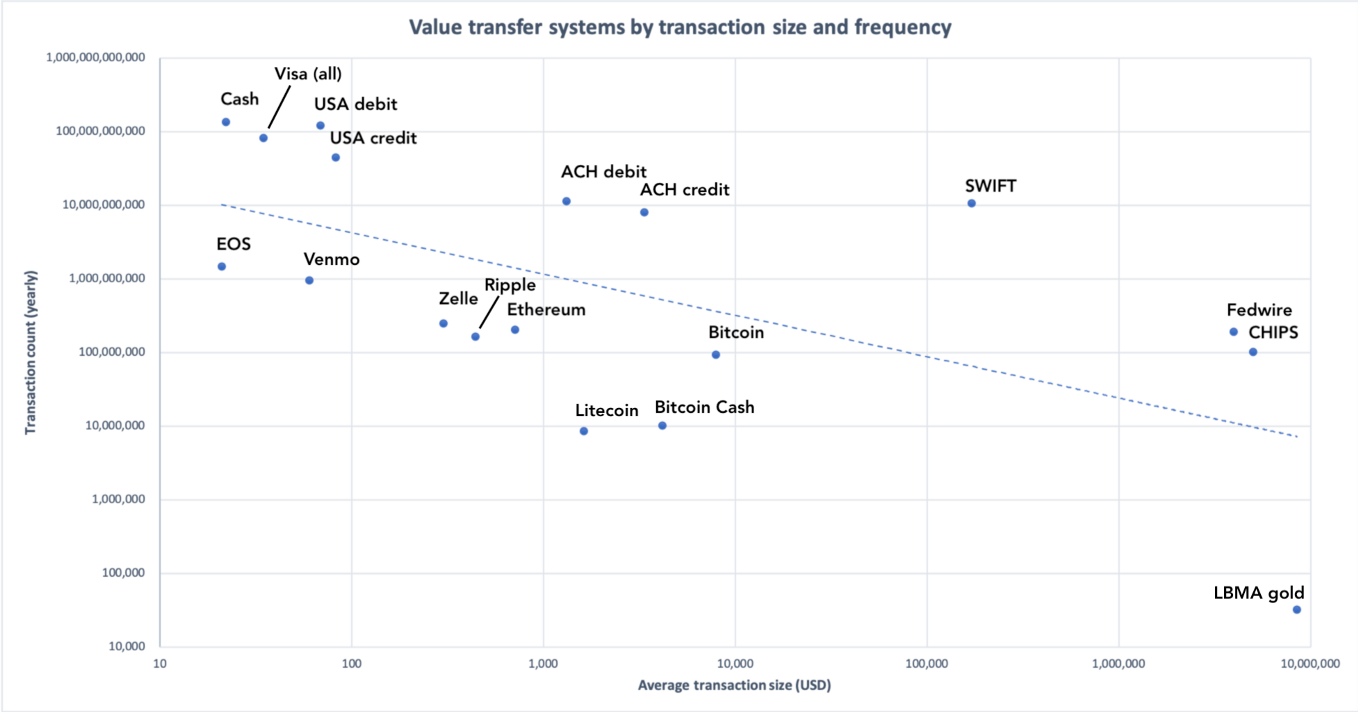 Blue dotted line represents the exponential best fit
This is the most comprehensive view. It demonstrates clearly that you have settlement-like networks towards the bottom right, and payment-like networks on the top left. Bitcoin is edging closer and closer to the bottom right, as base-layer transactions encode progressively more value. Let’s exclude the megalarge settlement networks and focus on the payments networks.
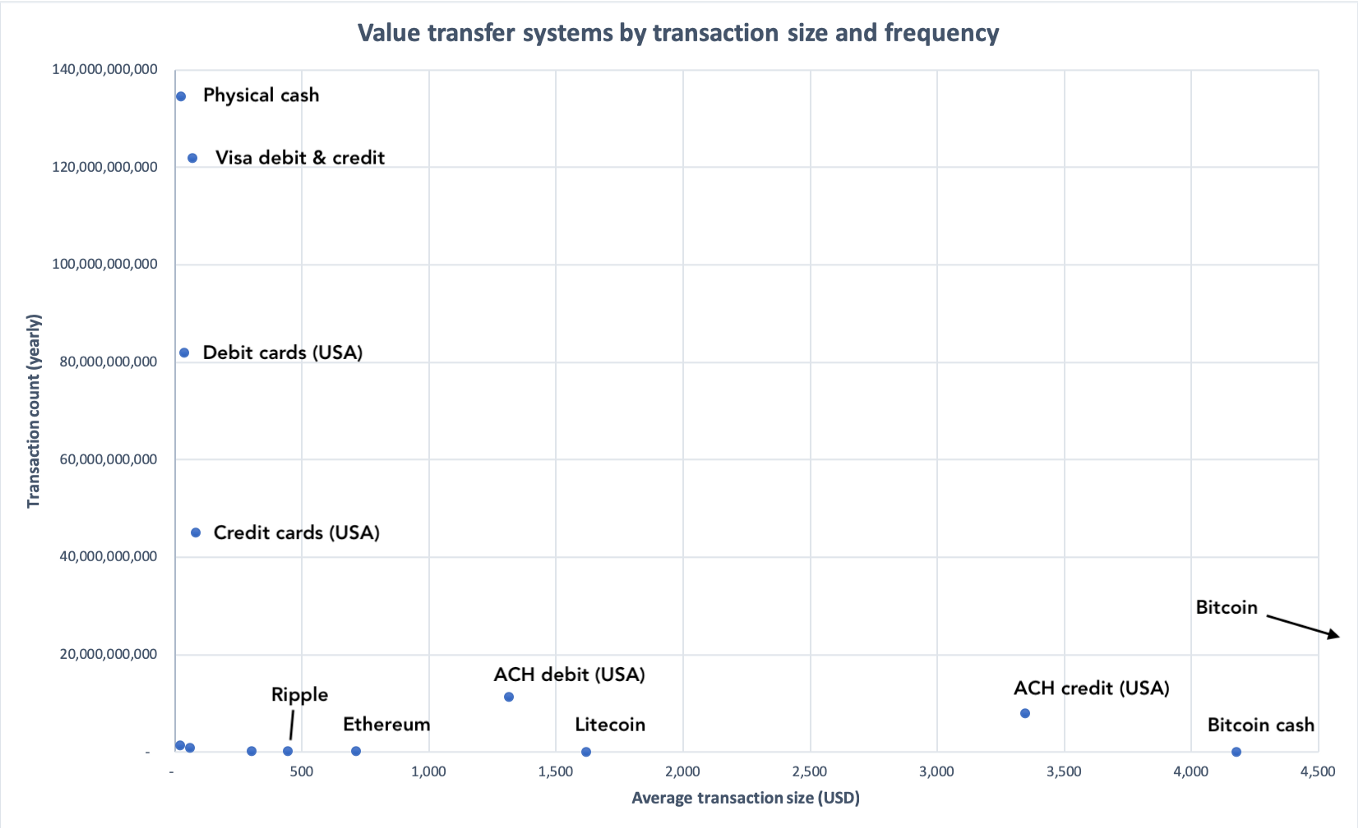 Chart truncated to show a subset of the data
As you can tell, most cryptocurrencies can barely lift themselves off the X axis — they don’t have the throughput, or crucially, the adoption, to work as mainstream payments networks.
So what is Bitcoin for, anyway?
As shown on the chart, Bitcoin transactions tend to be quite large. It’s hard to know the precise number, but your average transaction will be in the thousands of dollars, possibly tens of thousands. Your median transaction is well over $100.
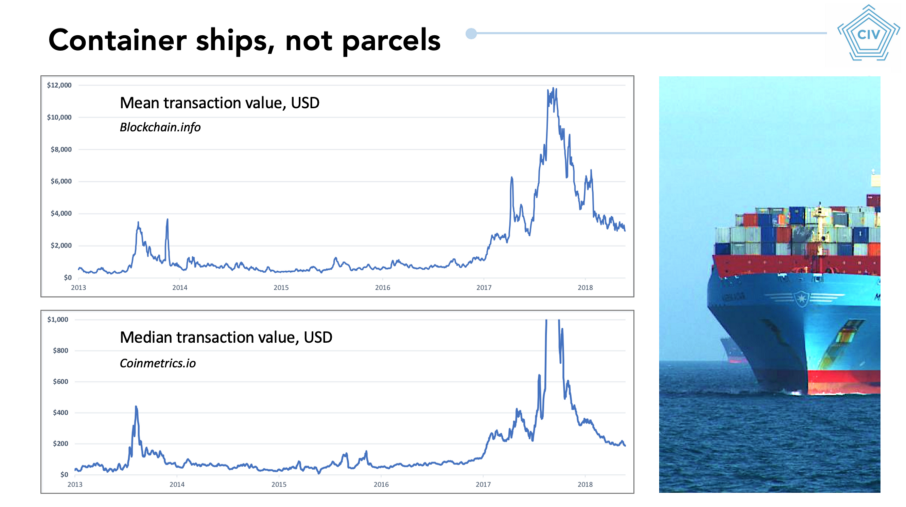 Slide from ‘Bitcoin as a novel economic system,’ my presentation at Baltic Honeybadger 2018
Large transactions are partly out of necessity: exchanges will often batch together many cashouts to investors into a single transaction, to reduce the per-payment overhead, which increases transaction size; and fees in the single-digit dollars mean that only larger transactions are worth it from a fees perspective.
More saliently, though, the strong assurances of global final settlement that Bitcoin provides are simply not required for low-value transactions. Typical usage of the system tends to be scaled to the assurances that the system provides . You don’t drive an armored personnel carrier down the street to get a packet of cigarettes — you don’t need those security guarantees. You don’t wear body armor when you walk to work. You don’t put your petty cash in a safe and handcuff it to yourself when you buy groceries.
What critics miss when they fixate on TPS is the simple fact that the users of these systems tend to have a good idea of what they want from them. Low-stakes, small value transfers with some reversibility guarantees work just fine on Venmo, Paypal, or Visa. Yes — these don’t work for the unbanked, but then again virtually no financial infrastructure does. This stuff takes a long time to build, as does the trust in the system.
What a low bandwidth-in-bytes but high bandwidth-in-dollars system like Bitcoin works for is large, inter-jurisdictional, money-for-enemies transactions where mutual trust is lacking and rapid settlement is desired. If mutual trust is present, or deferred settlement is acceptable, or the payment size is very small, base-layer-bitcoin is not the system for you! Vanilla Bitcoin is useful for a tiny fraction of all of the payments or value transfers that happen on a given day. And that’s fine!
Bitcoin lives on the bottom right size of the size/frequency chart. Those 3 or 4 transactions which happen per second on Bitcoin are exactly what its users are after. That very particular, idiosyncratic use case doesn’t really overlap with systems like Visa, Paypal, Alipay, or Venmo. They aren’t teleologically comparable: they aren’t trying to do the same thing.
Is it fair to compare them? Yes, but only if you are mindful of the tradeoffs made by each system.
“Why can’t fruit be compared” — Lil Dicky
Additionally, Bitcoin’s near-immediate physical settlement opens up a large design space allowing developers to add cheaper, more convenient payments networks with deferred settlement. This is Lightning and other second-layer solutions: cheap, near-instantaneous transfers which periodically settle to the base layer. The truth is that not all transactions merit final settlement within minute of occurring; for these petty cash situations you are better off using a higher layer. Bitcoin — and increasingly, Ethereum too — is developing precisely with this in mind.
So, in short, value transfer systems vary along at least three major axes, not just one. The response to “Our system does 500,000 TPS” is “at what cost?” Are you deferring settlement? Do you have a single validator? Do you require that transactors be part of the US-controlled financial system?
In my view, economic throughput — the dollar equivalent value flowing through the system per unit of time — is a far more comprehensive view of the system than the simple message-send-rate (TPS). Measure the area under the point, not just the Y value. From that more holistic perspective, Bitcoin is a single order of magnitude away from Visa.
Appendix
For data collection, recency was sought. Data for major cryptocurrencies comes from coinmetrics.io. Both adjusted transaction volume and transaction count were smoothed on a trailing 30-day basis and annualized. Raw or nominal transaction volumes for cryptocurrencies are noisy and bias the figures upwards, and so Coinmetrics performs transparent adjustments and de-noising to render the figures more conservative.
Data for legacy financial systems is found in 10K reports, news articles, and academic studies and annualized. Figures for CHIPS and Fedwire are somewhat out of date and hence should be interpreted as rough order of magnitude estimates. SWIFT data is taken from the most recent quarter and annualized but does not imply settlement volume but rather financial messaging.
Building a fundamental piece of technology that will bring Bitcoin to the next billion users? Reach out: castleisland.vc .