
Introducing Binary Adjusted BDD, VOCD and Reserve Risk
| If you find WORDS helpful, Bitcoin donations are unnecessary but appreciated. Our goal is to spread and preserve Bitcoin writings for future generations. Read more. | Make a Donation |
Introducing Binary Adjusted BDD, VOCD and Reserve Risk
An Exploration of Bitcoin Days Destroyed
By Hans Hauge
Posted May 30, 2019
Bitcoin has been an endless source of fascination for us here at Ikigai for a number of reasons. Not the least of these is the fact that Bitcoin has a fixed issuance schedule which halves every four years and will terminate in the year 2140. Since price ultimately boils down to the intersection of supply and demand, and the supply is known; if we can quantify demand then we should be able to frame some price expectations into the future.
Unfortunately, quantifying demand is nontrivial, and forecasting demand can be perilous. Many attempts have been made to this end, but much confusion remains.
One way to characterize demand is to separate long-term investors from speculative traders via the age of the coins being moved. To illustrate this concept, imagine two participants in the Bitcoin network:
| Bitcoin Newcomer “Newb” | Bitcoin Veteran “Vet” | |
| Age of Coins Held | Recently purchased | Held for years |
| Information Edge | Low information; confused | High information; confident |
| Conviction | Highly speculative; weak hand | HODLer; strong hand |
The movements of the Newb are more likely to be sporadic, random, or unwise. For example, buying into the top of a bubble or selling at the bottom.
On the other hand, the Vet is more likely to be familiar with the market cycles and to time his purchases and sales in order to maximize his return on investment.
While there are exceptions to every rule, in the aggregate we believe we can make the following broad assumptions:
| “Newb” | “Vet” | |
| Buying | Greed / Random | Bullish |
| Selling | Fear / Random | Bearish |
Now then, having made this distinction, let’s consider what information may be hiding in plain sight within the Bitcoin UTXO set.
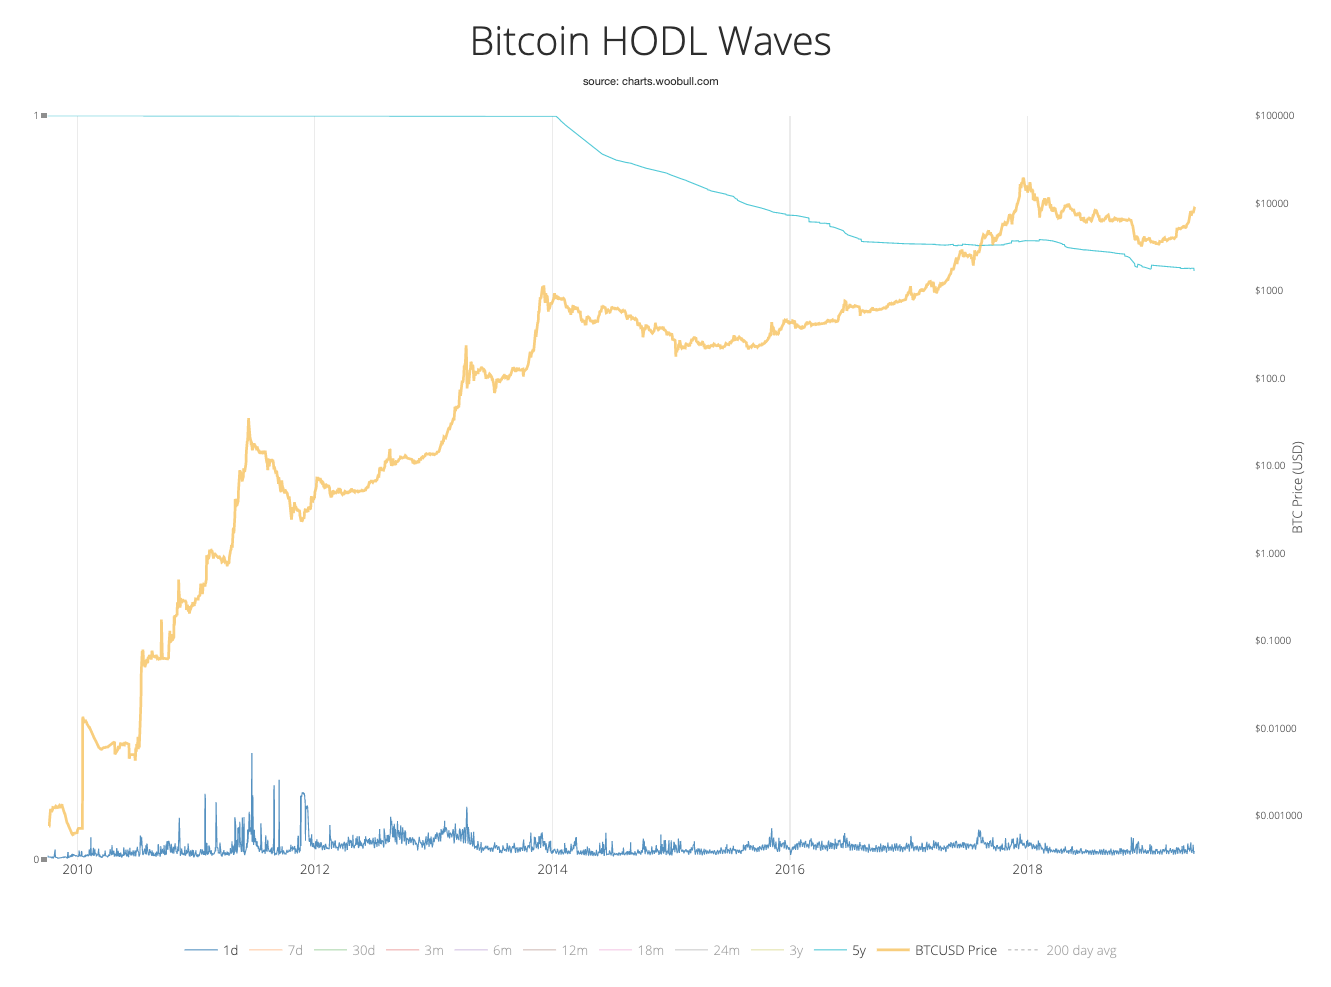
HODL Waves
 Source: Woobull.com
The chart above shows what percentage of the UTXO set is at which age. Note that the “5y” group has increased dramatically (shown by moving down in this case) and now accounts for more than 20% of all Bitcoin in circulation (over $30B at this time).
Compare this with the static sideways action of the seven-day segment for example . Essentially, short-term speculation has remained relatively constant while long-term holding is constantly increasing. We find this to be deeply bullish.
What are Bitcoin Days?
Bitcoin days are defined as the quantity of Bitcoin multiplied by the number of days since those coins were moved. The idea here is to segment coins in circulation into the Vet and Newb buckets. Of course, we could attempt to identify as many groups as we like - lost coins; algo market makers; the Winklevoss twins; etc. But the swing traders (or Swing HODLers if you prefer) would be somewhere between Newbs and Vets, who hold Bitcoin for 1-3 years and attempt to capitalize on the patterns of bubbles that have emerged over time. More on the Swing HODLers later.
By assigning a higher value to a coin that has been idle for longer, Bitcoin days more accurately reflect market participants who have been in the ecosystem for longer. Since the price has increased markedly over time, these users have seen their investments multiplied by orders of magnitude. In other words, a newcomer selling one Bitcoin he bought last week is less meaningful than the movements of very old coins owned by the participants from the early days.
Why do Bitcoin Days accumulate?
Bitcoin days accumulate over time because Bitcoin is not a perfect method of exchange (MoE). We can imagine a world where each Bitcoin is exchanged with someone else or for something else each day. If we lived in that world, Bitcoin days would never accrue.
We will revisit this concept in a moment.
What are Bitcoin Days Destroyed?
Now that we understand how Bitcoin days are created, let’s talk about how they are destroyed. Once a Bitcoin has been idle for a period of time, moving that Bitcoin “destroys” the number of days that it has accrued. As an example, if I purchased 1 Bitcoin and held it for 7 days, when I move that Bitcoin from my wallet the Bitcoin days are considered destroyed. One BTC held for 7 days would destroy 7 Bitcoin Days when it was moved (7 BDD).
The Bitcoin itself is not actually destroyed here, just to be clear. BDD is just a metric. Rather it’s assumed that the Bitcoin has been used to purchase something (Pizza, Lambo, etc), or it was moved to an exchange to be sold and now has a new owner.
There are two noteworthy points we should mention before proceeding:
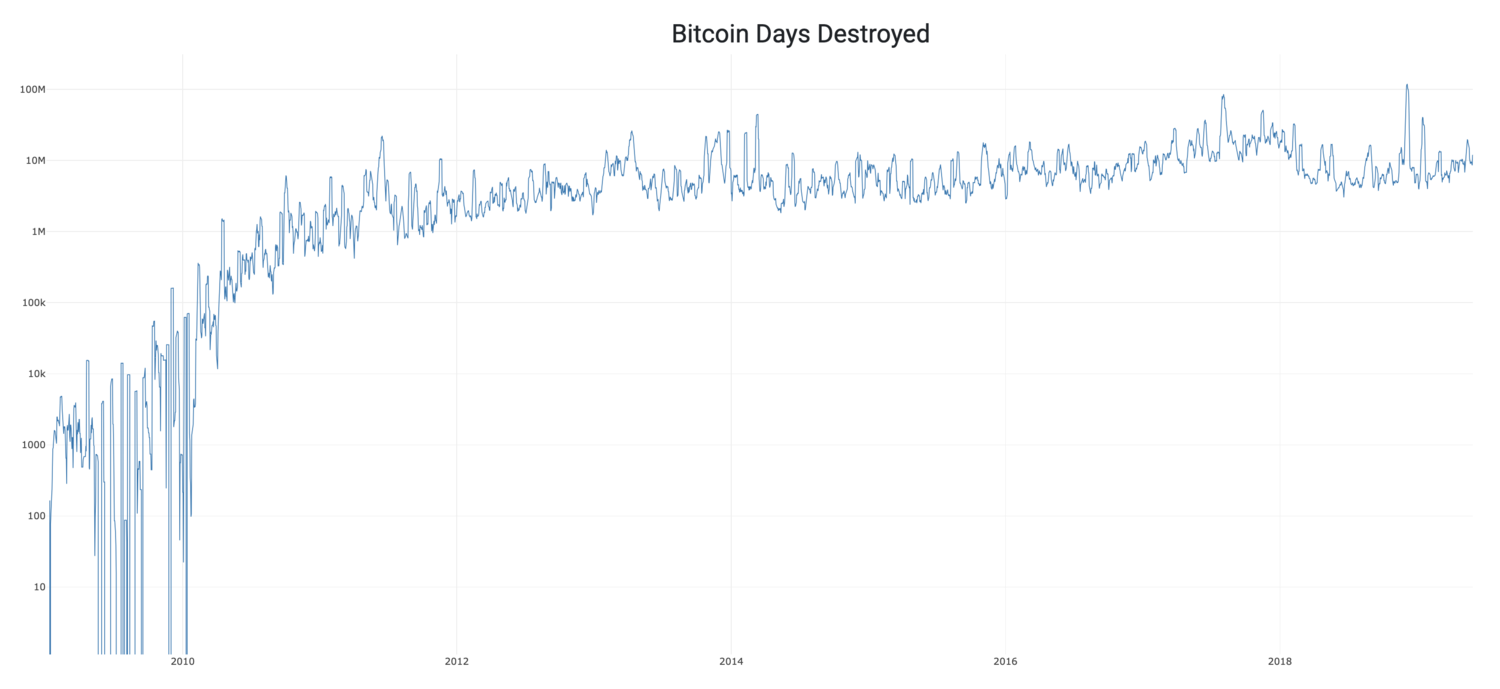
1. Exchange operators hold large amounts of Bitcoin. From time to time they may need to move cold wallet funds to upgrade their wallets, or for other reasons. This movement can be misclassified as “whales cashing out” when it’s actually a nonevent. 2. The number of Bitcoin in circulation is increasing over time. Therefore, the number of Bitcoin days that are created each day is increasing too. If we simply look at the number of BDD over time, it at first appears that an exit stampede is underway.
To understand this more fully, consider the following chart that simply displays the number of BDD over time.
 Source: Blockchair.com
In order to account for this increase over time, we have created Adjusted Bitcoin Days Destroyed, which simply divides BDD by the circulating supply (total BTC issued) on each day. Adjusted BDD more accurately represents the quantity of Bitcoin sold by long-term holders over time.
Adjusted BDD = BDD / Circulating Supply
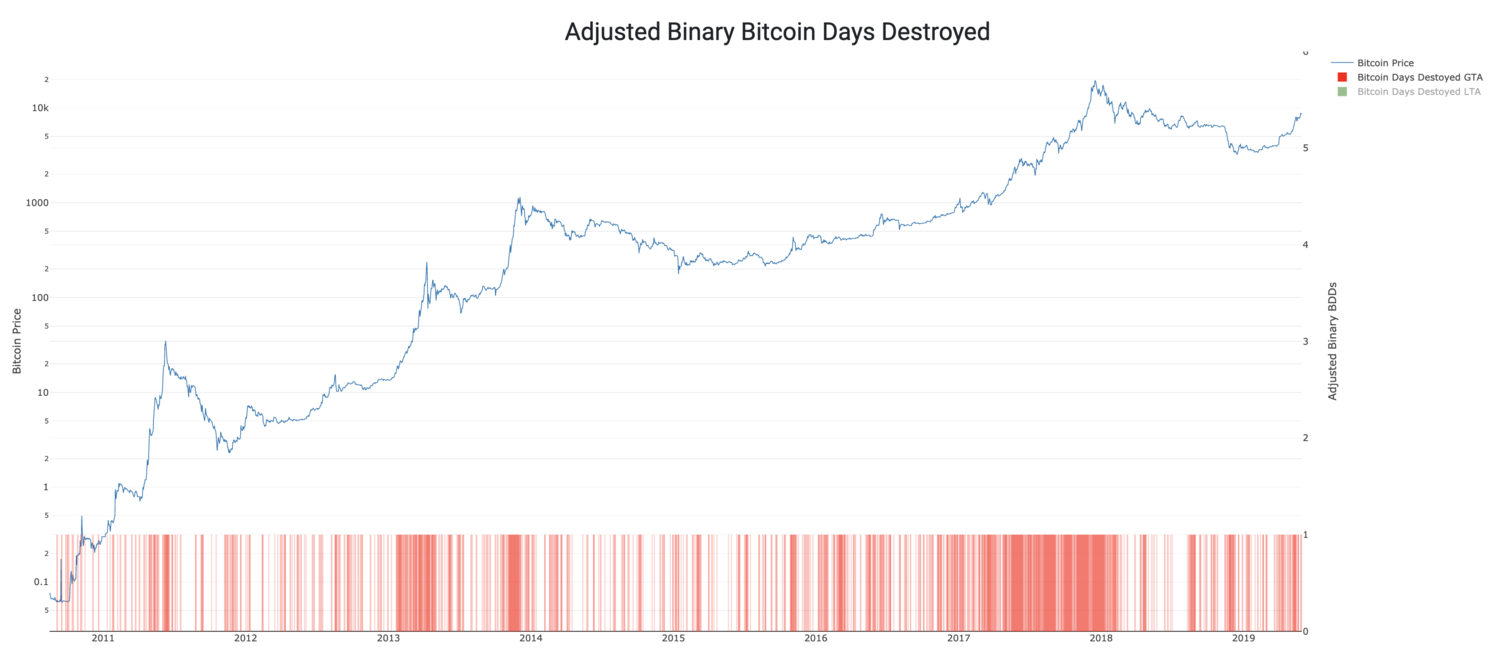
In order to minimize the impact of exchange movements, which do not accurately reflect behavior of the long-term holders (HODLers), we took the mean destruction over time and asked a simple question. “Were there more Adjusted BDDs destroyed today than average?” The answer to this question can be seen below. Red Candles represent days in which the answer was “YES.”
 Source Data: Blockchair.com, Blockchain.com
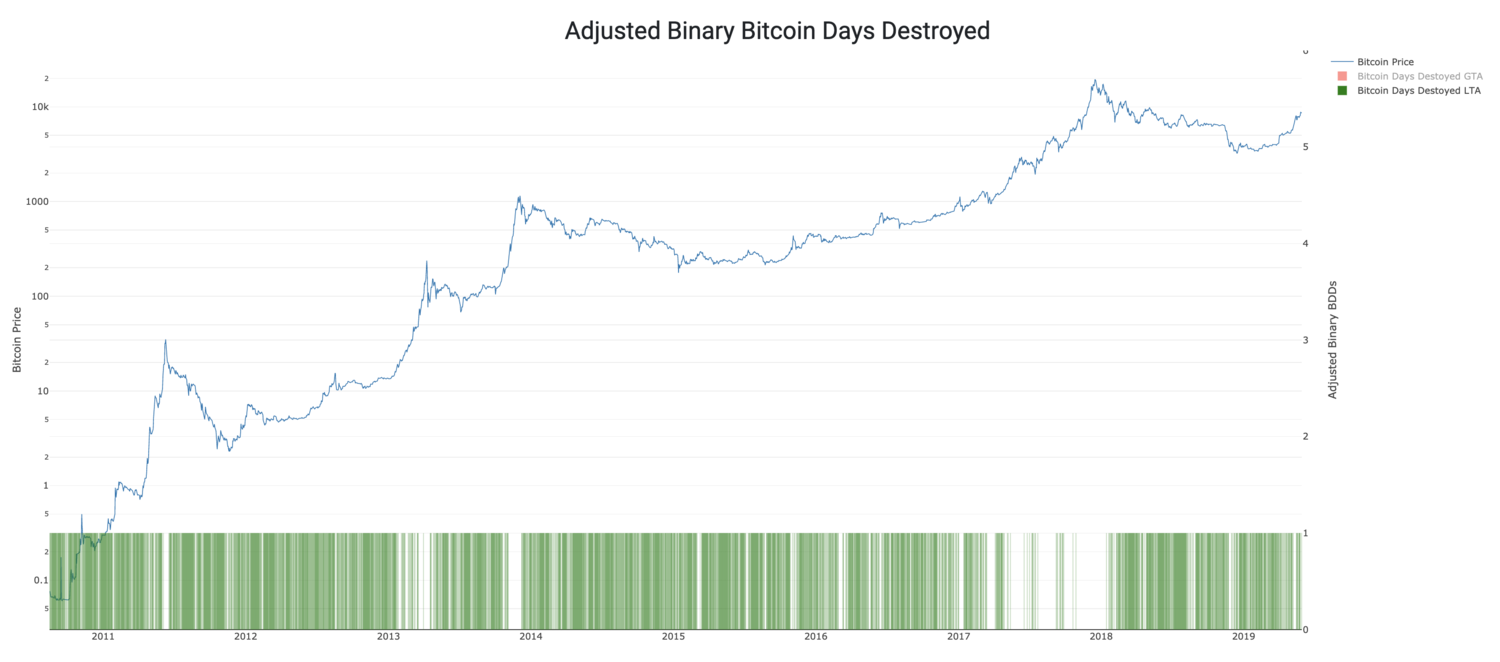
As we can see, mid to long-term market participants seem to do a fairly good job of exiting the market near the peaks of bubbles. Even more interesting is to think about the times when the answer to this question was “NO.”
 Source Data: Blockchair.com, Blockchain.com
Here we can see times of accumulation marked by the green candles. This buy-side support sets the stage for what’s to come.
Now that we have an understanding of how BDD and especially Adjusted BDD can be useful to us, what else can we do with this information? When we started off, we said that quantifying demand was paramount for Bitcoin valuation. Might there be a way to use the UTXO set to help quantify this?
Let’s revisit the concept of the HODLer calculus. If someone has a Bitcoin today and decides against selling it, what is their motivation? Logically they are expecting that it’s going to be worth more in the future. So, what if we put a number to the opportunity cost given up by this decision.
Value of Coin (Days) Destroyed
If I have a single Bitcoin today, the value I can get from that coin is the market price of 1 BTC. In terms of US Dollars that would be around $8,400 at time of writing. If we look at the number of BDD on a given day, we will note that this figure rarely exceeds the circulating supply. There are, however, some exceptions to this - such as during the peaks of bubbles - when more Bitcoin days are destroyed than the supply of Bitcoin in circulation. Those periods are worth noting.
Stated differently, if every Bitcoin that has been issued so far were to change hands today, and each of those Bitcoin had been held for exactly one day, then the number of BDD that day would equal the circulating supply (this means Bitcoin days would remain unchanged). In this instance, the BDD * BTC Price would equal the market cap. Or, simply the Adjusted BDD equals 1. To illustrate this, we have created the Value of Coin (Days) Destroyed, or VOCD.
VOCD = ∑ (Daily Bitcoin price * Adjusted BDD)
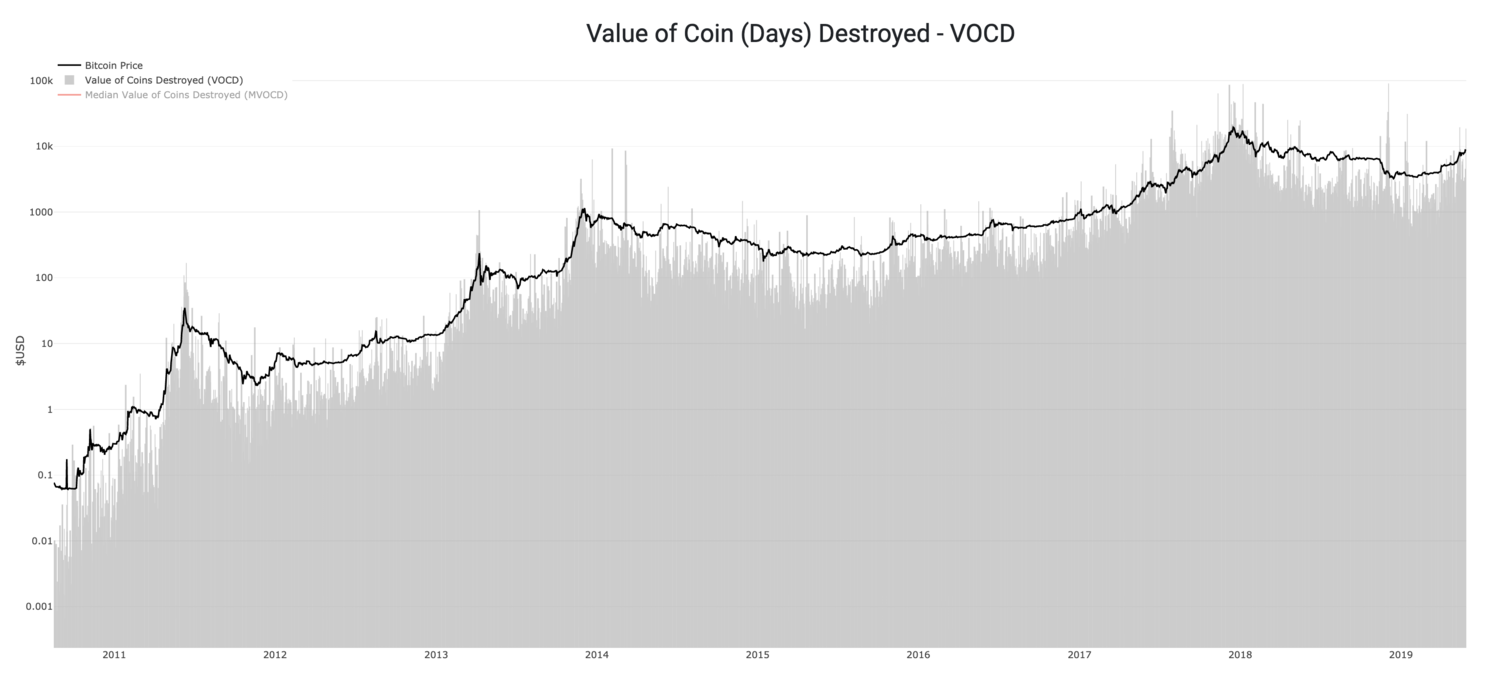 Source Data: Blockchair.com, Blockchain.com
BDD is a time-Bitcoin quantity metric. VOCD is a time-USD quantity metric. When the gray line overtops the black line, that means the VOCD is greater than the Bitcoin price, or that more BDD are being destroyed than created on that day.
MVOCD
In order to back out those large exchange wallet migrations we mentioned earlier, we take the median of VOCD over 30 days and create the MVOCD.
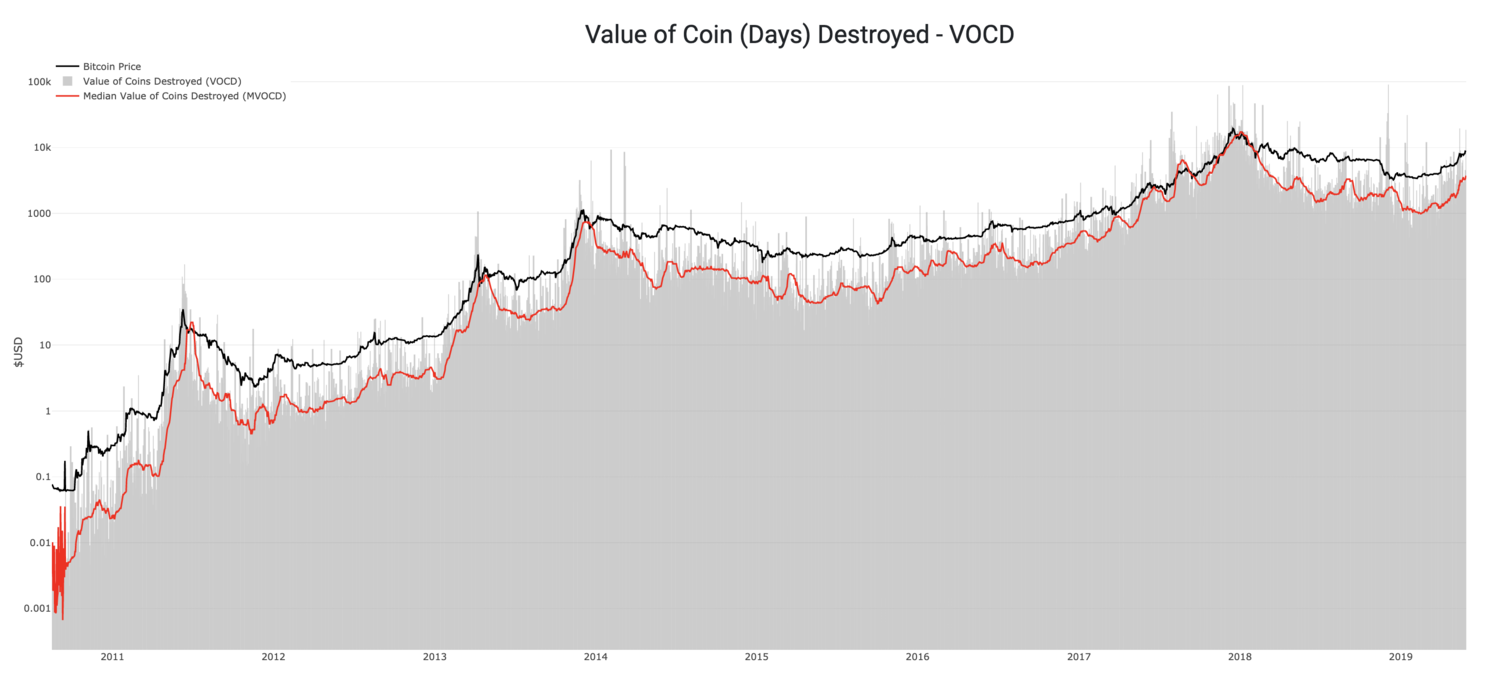 Source Data: Blockchair.com, Blockchain.com
Each day that MVOCD does not exceed the price of Bitcoin, more Bitcoin days are being created than destroyed. We might think about this as the opportunity cost of the holder. If I hold a Bitcoin today that’s worth $8,400 on the open market, I’ve given up $8,400 in order to keep holding.
By summing the aggregate US Dollar amount over time, you arrive at the cumulative opportunity cost that made the decision to hold rather than sell over the lifetime of the Bitcoin network (scaled down to a single Bitcoin value terms). That is the HODL Bank.
HODL Bank
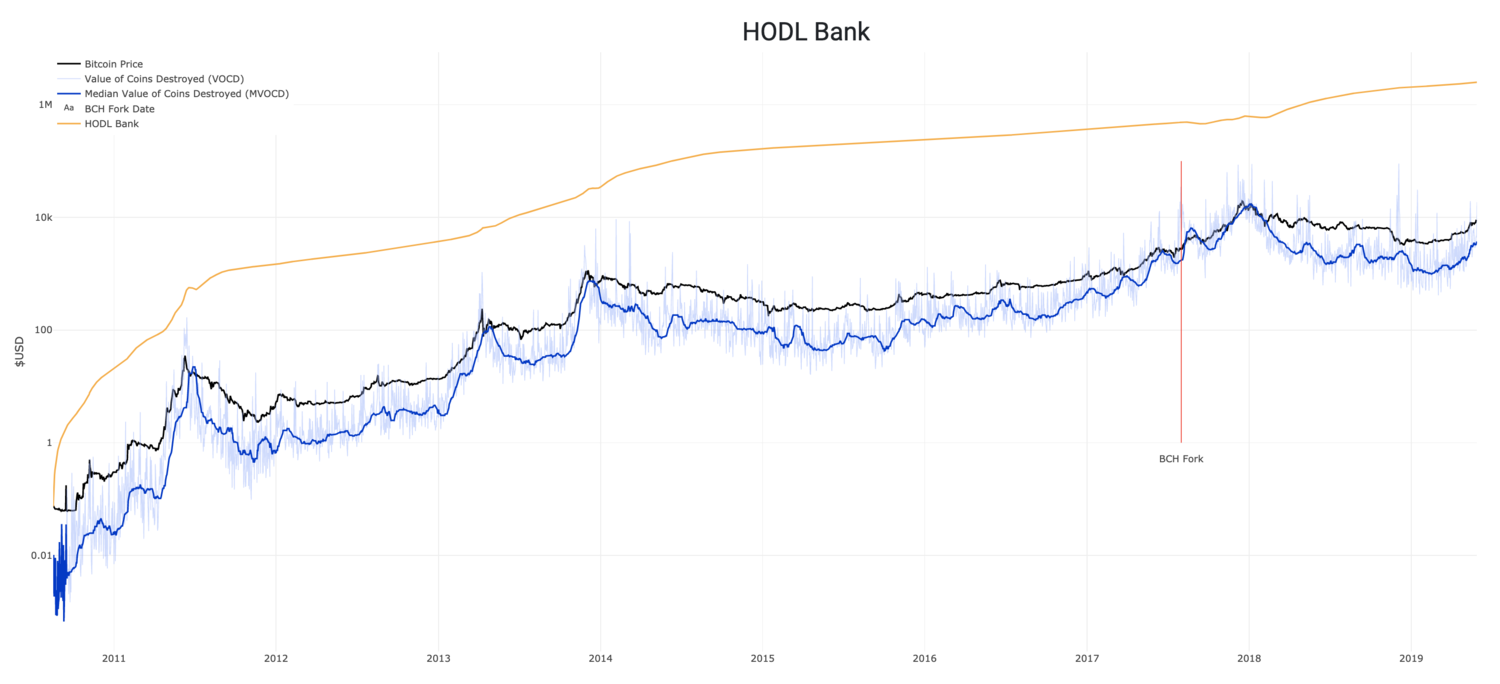 Source Data: Blockchair.com, Blockchain.com
How should we interpret the decision by holders to defer spending over time? A reasonable conclusion is that each day the network participants make this choice, they are placing a vote of confidence in the future economic value of Bitcoin. Think about it like this - how confident is the market in Bitcoin?
We might even suggest that the choice to purchase a Bitcoin is backed by the confidence of the existing and future participants. Would you want to buy into something that everyone is fleeing? What about something with a limited supply and increased HODLing? How can we determine which is the case?
The attractiveness of the price of Bitcoin today could be evaluated as the cost to buy Bitcoin today relative to the sum total of confidence built over time. If confidence is high and the price is low, then essentially the risk/reward is skewed attractively. Likewise, if the price is high and confidence is low, the risk/reward is skewed unattractively.
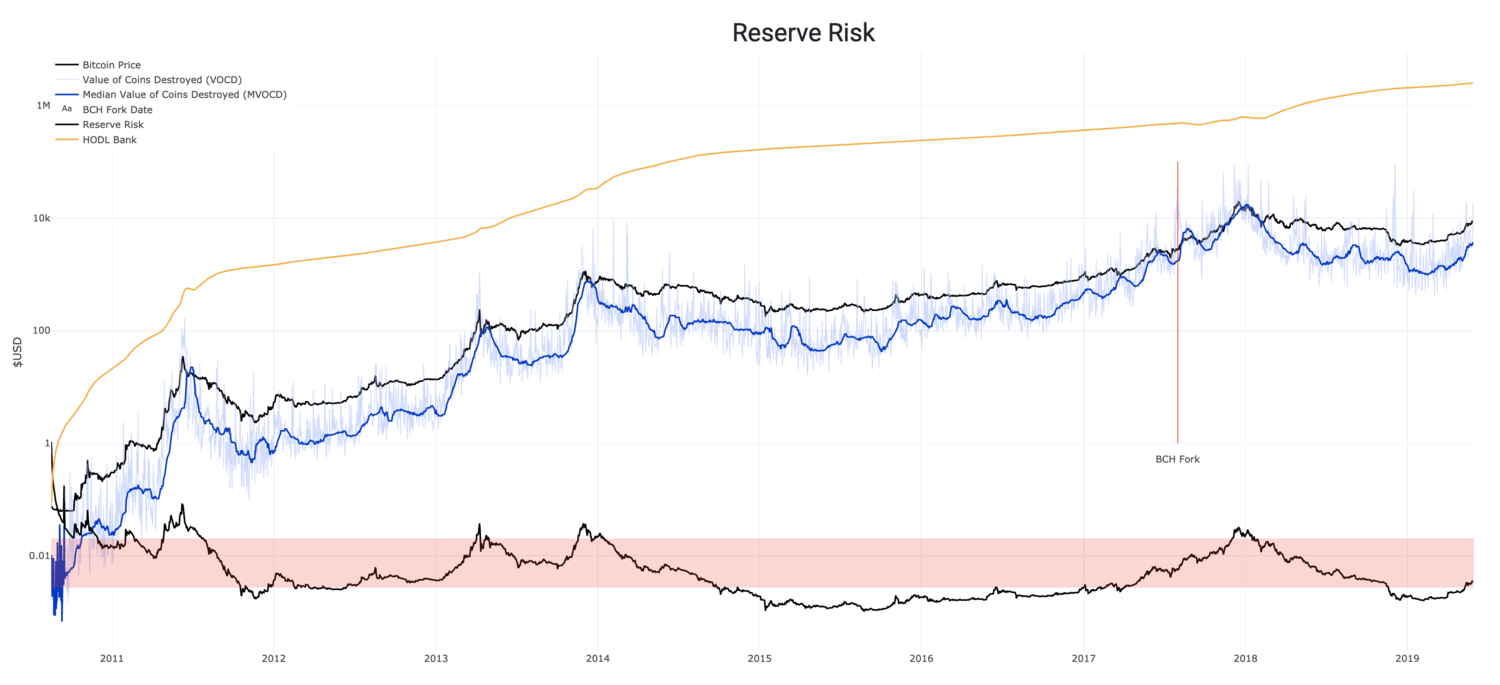 Source Data: Blockchair.com, Blockchain.com
We can accomplish this by dividing the price of Bitcoin at any point in time by the HODL Bank. This creates what we’ve called Reserve Risk.
Here we can see that purchasing Bitcoin when the Reserve Risk is the lowest (defined by a large HODL bank relative to the price at the time) has produced outsized returns. Reserve Risk in 2019 has recently hit a low near what was seen in 2011, but not quite as low as in 2015. Binary Adjusted BDD, VOCD and Reserve Risk give us conviction the market bottom is behind us, and give us clues to what the future may look like.
Special thanks to David Puell.