
Bitcoin Mayer Multiple
Bitcoin Mayer Multiple
By Trace Mayer
Unsure on original post date
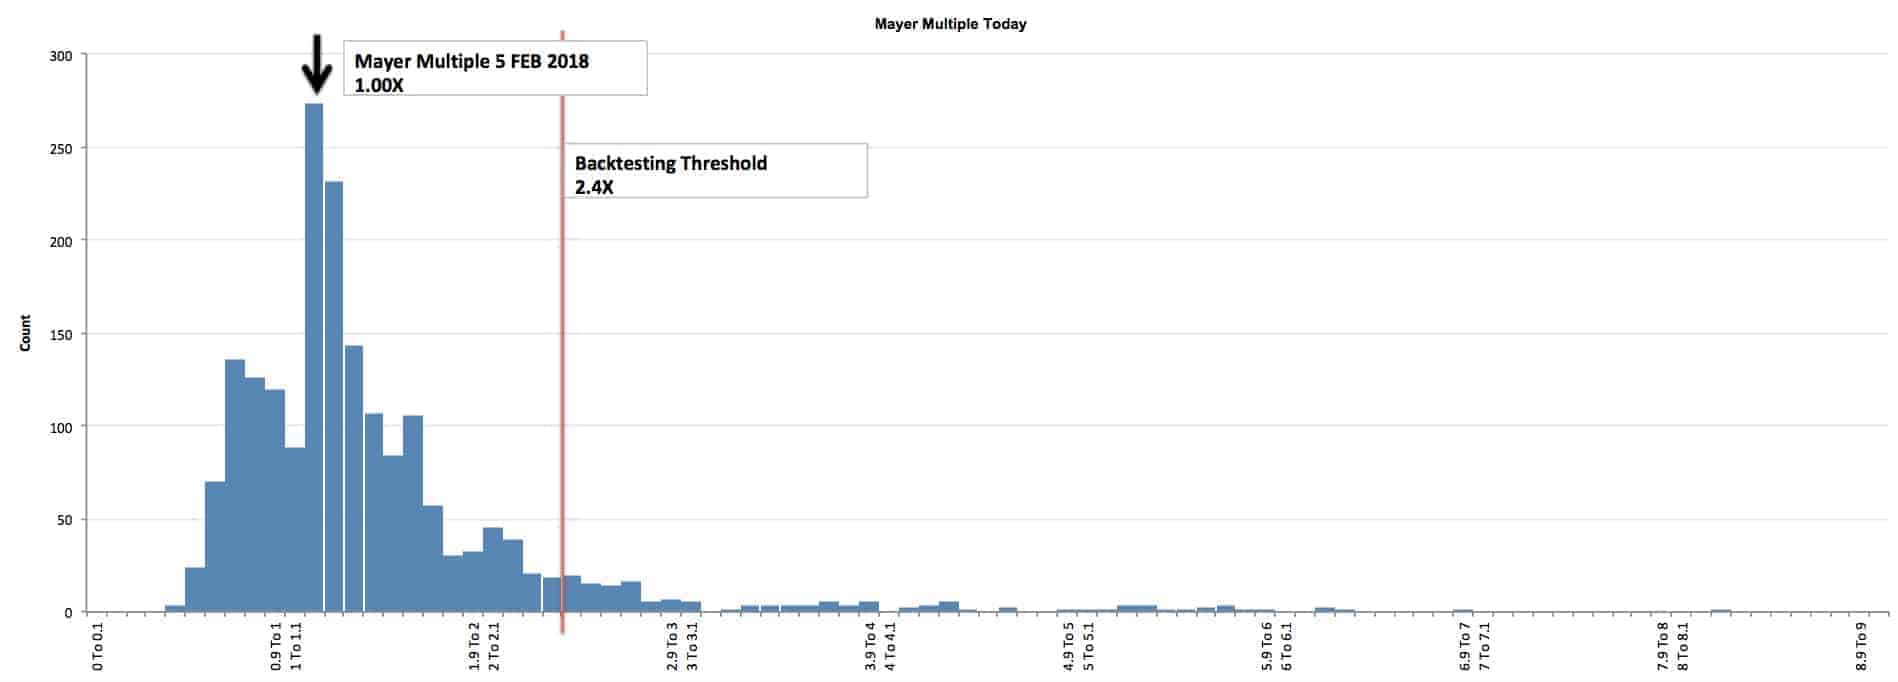
Below is a distribution chart of the multiple of the bitcoin price over the 200-day moving average. If a person decides to allocate a small portion of their portfolio to Bitcoin, this tool is intended to help people understand their emotions and corresponding probabilities of various price multiples (from a historical context). The charts and following information is not telling you to buy or sell Bitcoin. Bitcoin is insanely volatile. The charts do not suggest future results will be the same as the past. Please note, some suggest the long-term value of Bitcoin is high (in excess of $100,000 per Bitcoin), but there are also others that say Bitcoin is a mania and will be deeply regulated by the government if it is allowed to get too large. Either way, this page is simply a study to understand the probabilities of price multiples and what is normal and abnormal levels (from a historical context).
HOW THE MAYER MULTIPLE WORKS
The following explanation is how the to interpret the Mayer Multiple using 5 February 2018 at 4.00 PM EST as an example. Remember to check this page or follow us on Twitter, to get updates daily.
The 200 Day Moving Average is: $6858
The average Mayer Multiple is 1.47 for the history of Bitcoin.
The multiple on 5 February 2018 is 1.00X. A higher multiple has historically happened 75% of the time. A price less than $16461 would put the Mayer Multiple below 2.4X on 5 February 2018. A price of $10145 would put the price on the average multiple of 1.47X. The BTC price when this calculation was last conducted was $7000 USD.
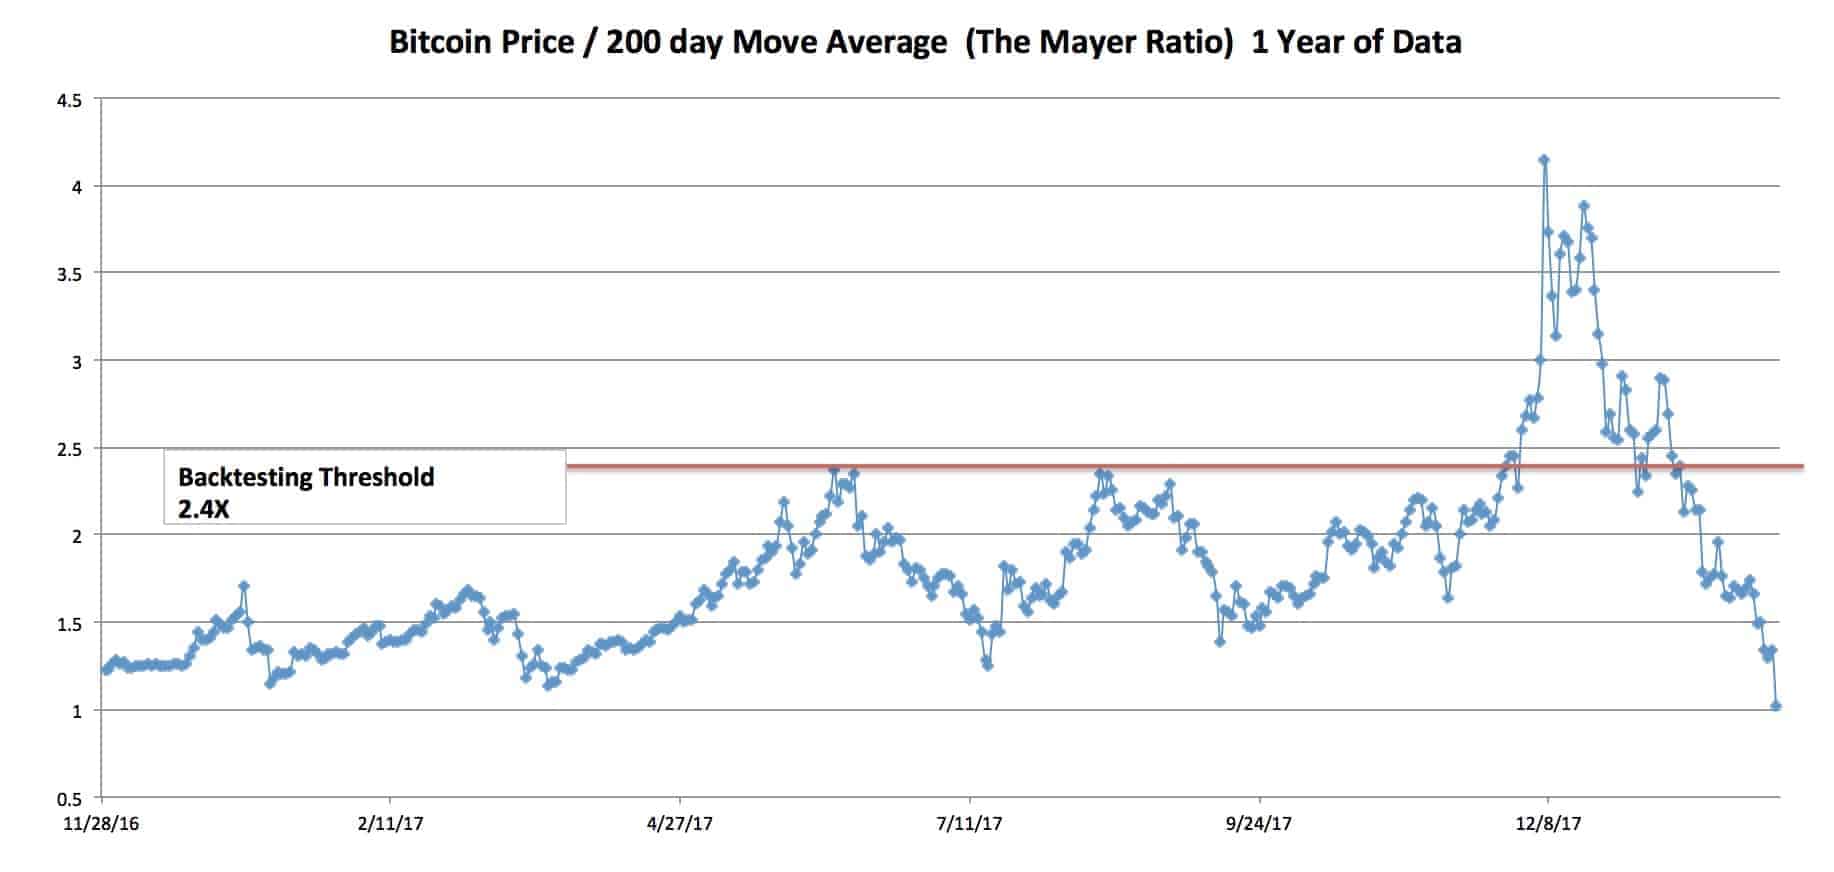
THE MAYER MULTIPLE SINCE THE INCEPTION OF BITCOIN
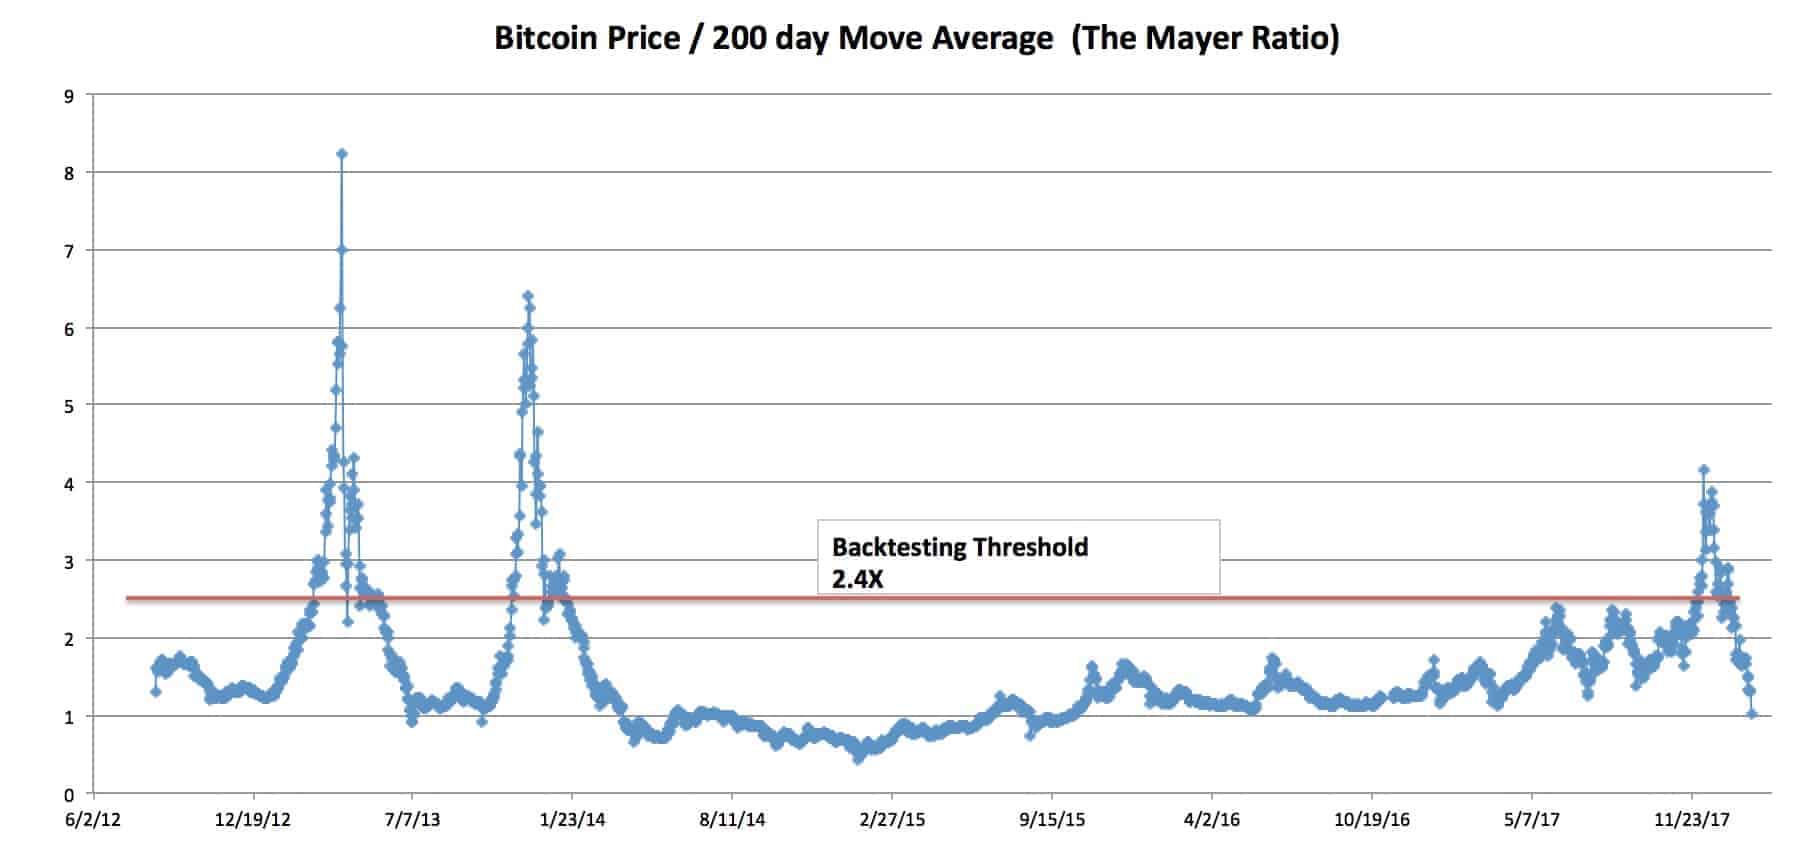
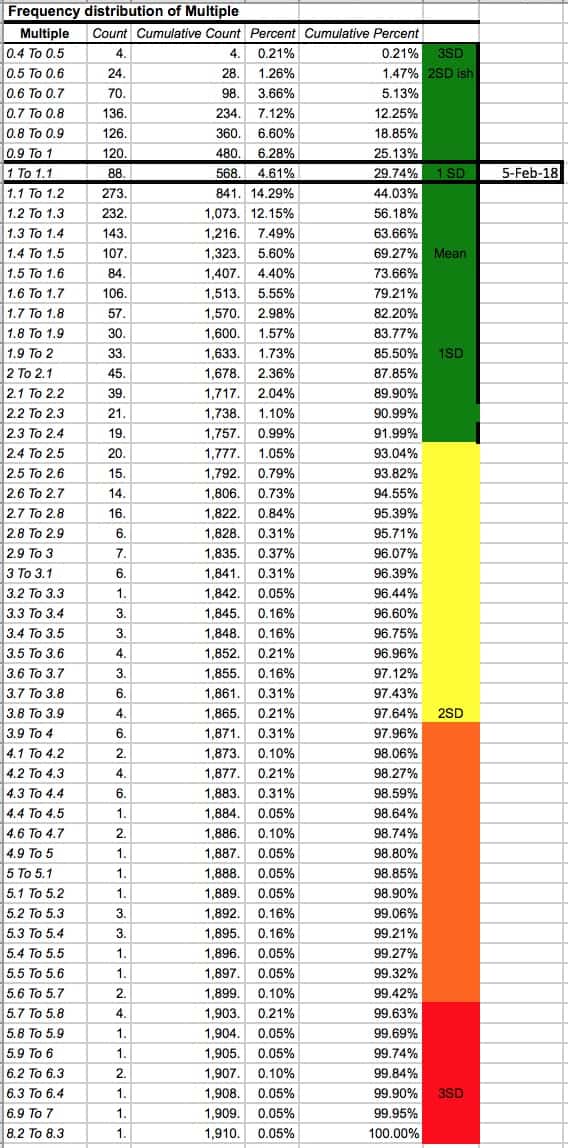
Please note: Bitcoin is not normally distributed. As a result, a typical Standard Deviation model is not accurate when talking about probabilities. With that said, this is the only model we can use to try and characterize normal and abnormal behavior. If you don’t like the use of this model, contact your college statistics teacher and he can help you invest in only absolute scenarios. Regardless of our distaste for academia, this model does have limitations and might not be the best way to represent the bitcoin price!
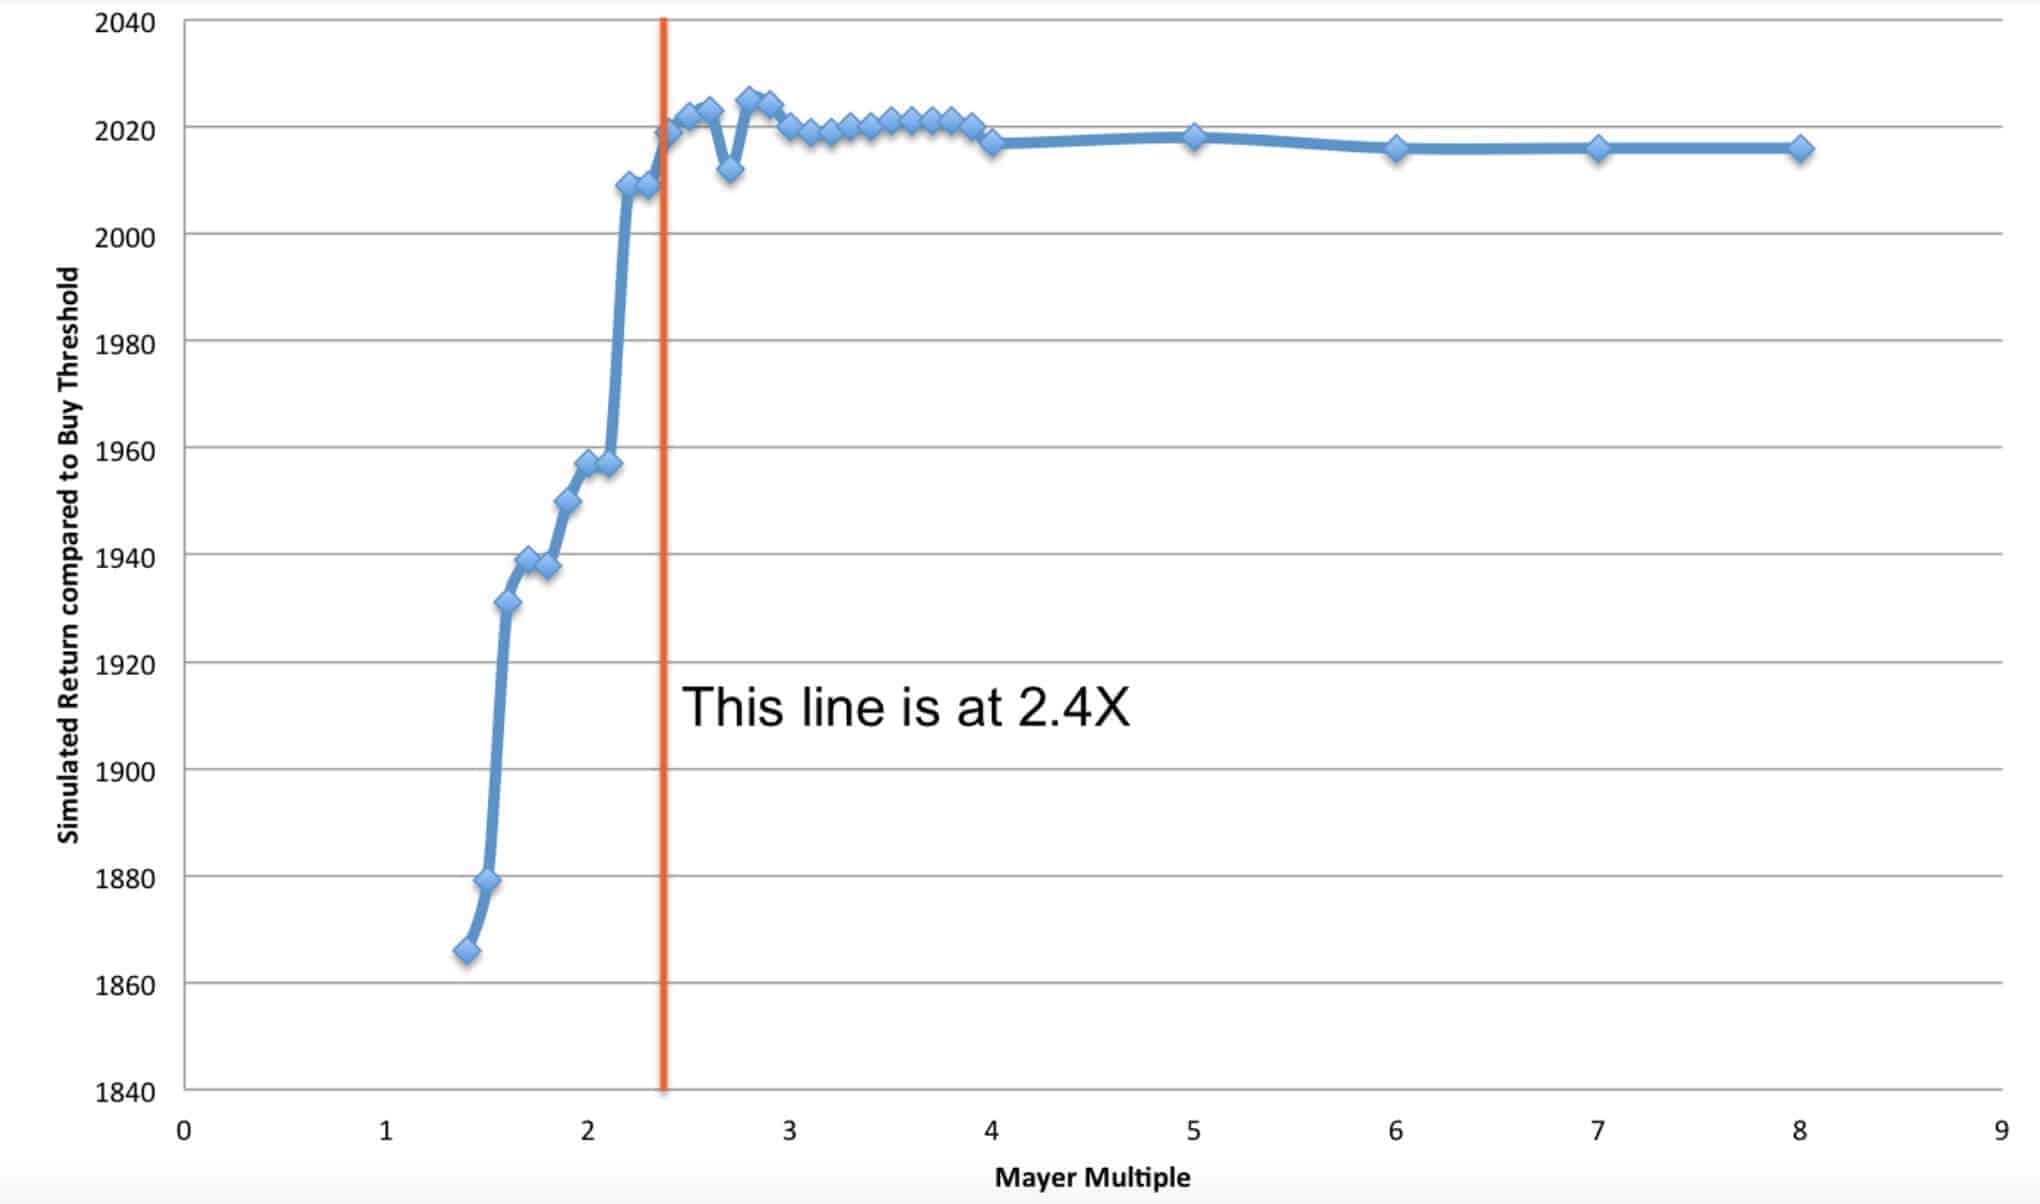
The chart below was determined by a simulation. The simulation assumed a person had $100 to invest in Bitcoin everyday since inception. There was only 1 control variable – the Mayer Multiple. If the price was < x Mayer Multiple, then the individual would buy $100 worth of BTC. If the price was >= x Mayer Multiple, the person would accumulate fiat until the price dropped back below x. The various x multiples that were tested are listed on the x axis below. When the simulation was run for various Mayer Multiples, it produced various returns (displayed in BTC on the y axis of the chart below). The chart demonstrates that anything over a Mayer Multiple of 2.4X failed to produce better results. When a multiple was selected below 2.4X, the BTC buyer got dramatically worse results. But, it’s very important to note that a new entrant buying below a 2.4X threshold would have an easier time emotionally during the first few quarters of ownership. Please note, every time the Mayer Multiple has gone above the 2.4X line, it has returned below 1.5X. In our simulation, we did not hold cash until reaching 1.5X (instead, the model simply purchased more BTC once below the 2.4X threshold). If the simulation would have waited for repurchase below 1.5X (after movement above 2.4X was achieved), the results would have likely been better than depicted below. This, however, may or many not be indicative of how the market might perform in the future, so those enhanced results were not displayed.
THE INTRINSIC VALUE AND NETWORKING EFFECT
The graph below shows how the value of Bitcoin might increase exponentially. The graph is derived from Metcalfe’s law that states that the value of a telecommunications network (fax machines, telephones, etc.) is proportional to the square of the number of connected users of the system. Companies like Facebook and Tencent showed that Metcalfe’s law, originally presented in 1980, held for both.
94% of the price movements from 2013-2017 has been explained by this law.
Questions? Please contact Preston Pysh or Trace Mayer .