
Bitcoin Market-Value-to-Realized-Value (MVRV) Ratio
Bitcoin Market-Value-to-Realized-Value (MVRV) Ratio
Introducing realized cap to BTC market cycle analysis
By Murad Mahmudov and David Puell
Posted October 1, 2018
Disclaimer: Nothing contained in this article should be considered as investment or trading advice.
Nic Carter from Castle Island Ventures (in a co-effort with Antoine Le Calvez from Blockchain.info) has recently presented his newly-termed concept of realized cap at Riga Baltic Honeybadger 2018 conference, inspired by some previous ideas of Pierre Rochard. Nic was kind enough to share some of his findings and data with us after the conference, and we wanted to delve into some analysis of the information available to us. For the purposes of this article, let’s define a couple of terms:
Market value
Otherwise known as total market capitalization, it applies to Bitcoin if you were to multiply the latest available BTCUSD trading price on exchanges by the number of bitcoins mined thus far (currently standing at 17,299,787 BTC as of Oct. 1, 2018).
Realized value
Instead of counting all of the mined coins at equal, current price, the UTXOs are aggregated and assigned a price based on the BTCUSD market price at the time when said UTXOs last moved.
The Logic Behind Realized Value
Realized cap’s effectiveness intuitively seems to adjust for two aspects of BTC’s nature: (1) lost coins, and (2) coins used for hodling, establishing the collective psychological sum of entries when users began seeing Bitcoin’s value and long-term potential. Realized cap seems to suggest the final layer of people’s cumulative cost basis and, in recent history, the ultimate line of “center of mass” where 2017 strong buyers remain unrattled by short-term uncertainty.
One way of looking at realized value is that it helps us eliminate some of the lost, unused, unclaimed coins from our total value calculations. Another way is seeing it as an indicator of the sum of levels where groups of long-term, legit, buyer-hodlers entered into their Bitcoin positions, with local and immediate emotions and manias stripped out.
MVRV Ratio
MVRV is calculated by simply dividing market value by realized value on a daily basis (in this case from Oct. 9, 2010 to Sept. 14, 2018). This formula provides the following oscillator:
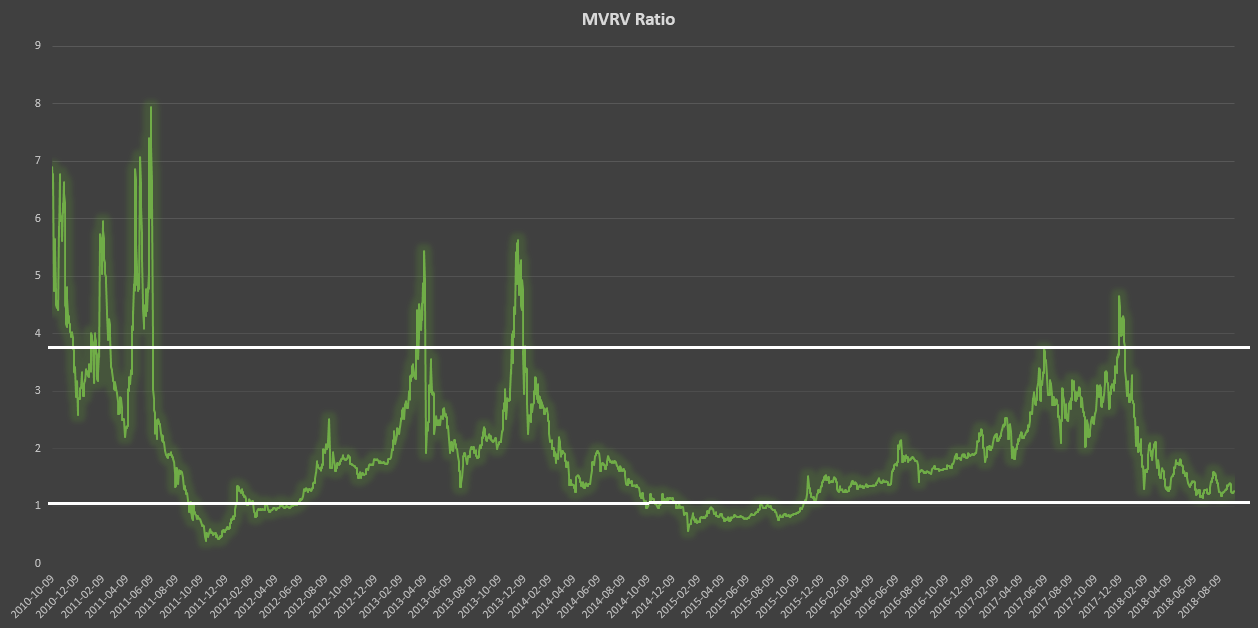
From this calculation, two historical thresholds emerge: 3.7, which denotes overvaluation, and 1, which denotes undervaluation. It is also interesting to see how MVRV evokes both the Mayer Multiple and Dmitry Kalichkin’s NVT signal without the need for a moving average.
Market Dichotomy?
A theoretical framework for this ratio would echo a dichotomy that can be best expressed in the following:
- Speculators vs. hodlers.
- High time preference vs. low time preference (as argued by Saifedean Ammous in chapter 5 of The Bitcoin Standard).
- Irrational exuberance vs. uncertainty acclimation (as argued by Jimmy Song in “The Antifragility of Bitcoin” presentation).
We believe that both market concepts and participants are crucial for Bitcoin’s game theory and price action, since the booms seem to expand the network via an exuberant viral gossip mechanism that broadcasts the existence of Bitcoin to the world population; while the busts, in the long-run, seem to reward individuals who chose to delay short-term financial gratification in the search for sound money. This very dichotomy, in our opinion, also explains the relevance and effectiveness of MVRV ratio. Network value, to go back to Willy Woo’s terminology, is to us both market value and realized value.
Similar to Woo’s NVT principle, MVRV appears to track the interaction between the market actors that best describe the aforementioned dichotomy. It suggests the at times major divergence between price discovery at exchanges and the “sounder,” more steady rise of unmoved coins — either lost or used for hodling.
It is of particular interest whenever market value goes below a 1:1 ratio to realized value. We suggest that these periods account for both undervaluation and the capitulation-despondency stages of market psychology. Just as the upper levels of MVRV suggest the climax of euphoria, overshooting it’s “fair” value at the peaks, price action as discovered at exchanges tends to undershoot beyond BTC’s “real” value at the bottoms. Looking back at the past two Bitcoin bear cycles, we can say without a doubt that both occasions proved to be the most opportune periods to accumulate bitcoins.
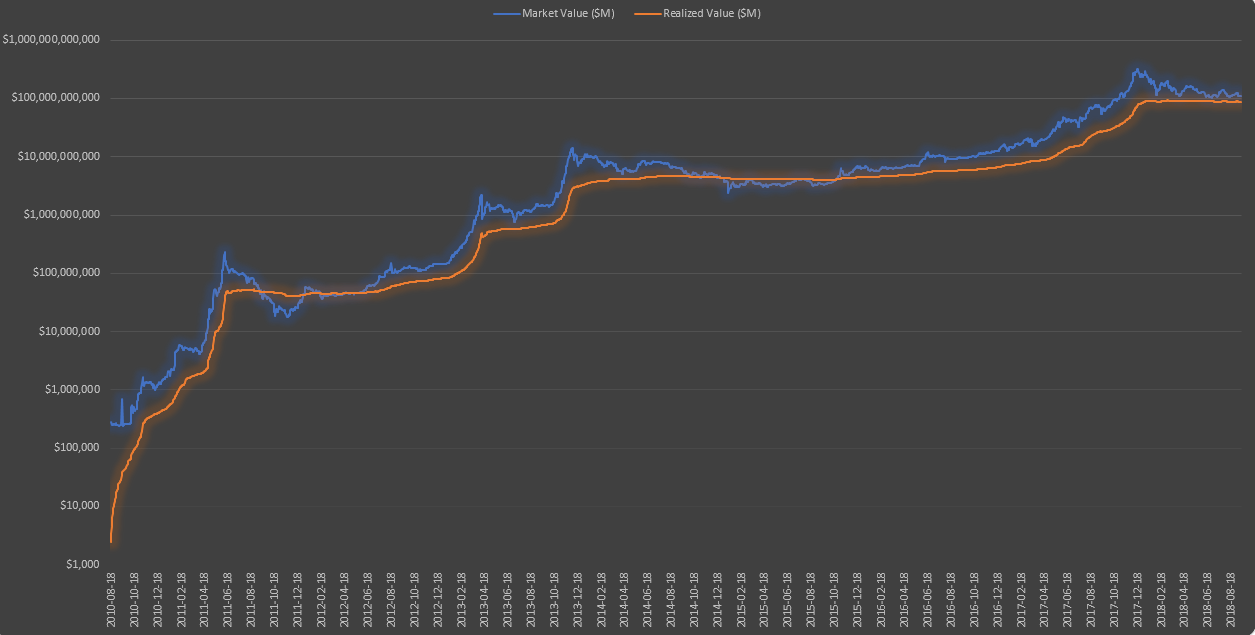
When plotted over the long run on a log chart, the realized value line of Bitcoin (orange above) is more similar to a stepwise function, with near-vertical moves upwards during peak months of bull market, then a prolonged period of horizontal flatness. That being said, each flatness level could be roughly interpreted as Bitcoin’s newfound stable fair value threshold. The traditional market cap, however, is more sharply pronounced by the emotion of the crowds, namely excessive euphoria when market value sharply diverges upwards away from realized value, and, conversely, excessive fear when market value drops below realized value for a multi-month period.
Current Environment
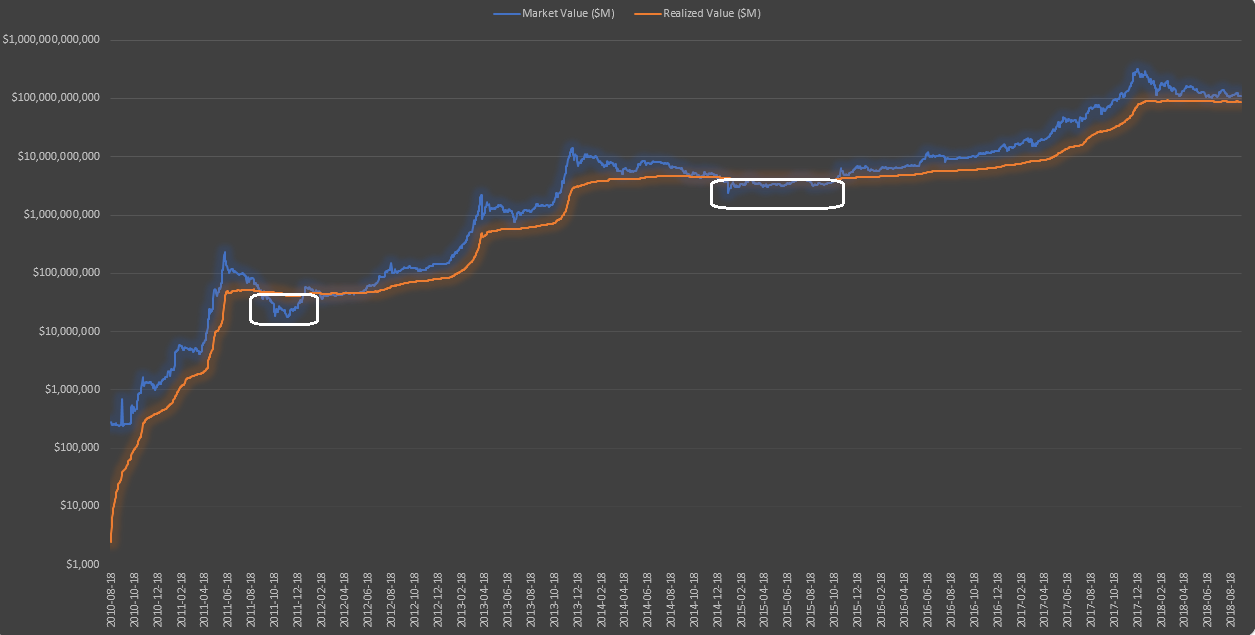
Simply put, we expect market value to descend below realized value on a mid-term basis, which in turn would establish a structural gap between them, to be filled after an accumulation period of potentially as long as several months. The following chart displays the historical periods when accumulation in Bitcoin took place (which would be represented by MVRV ratio’s descent below 1).
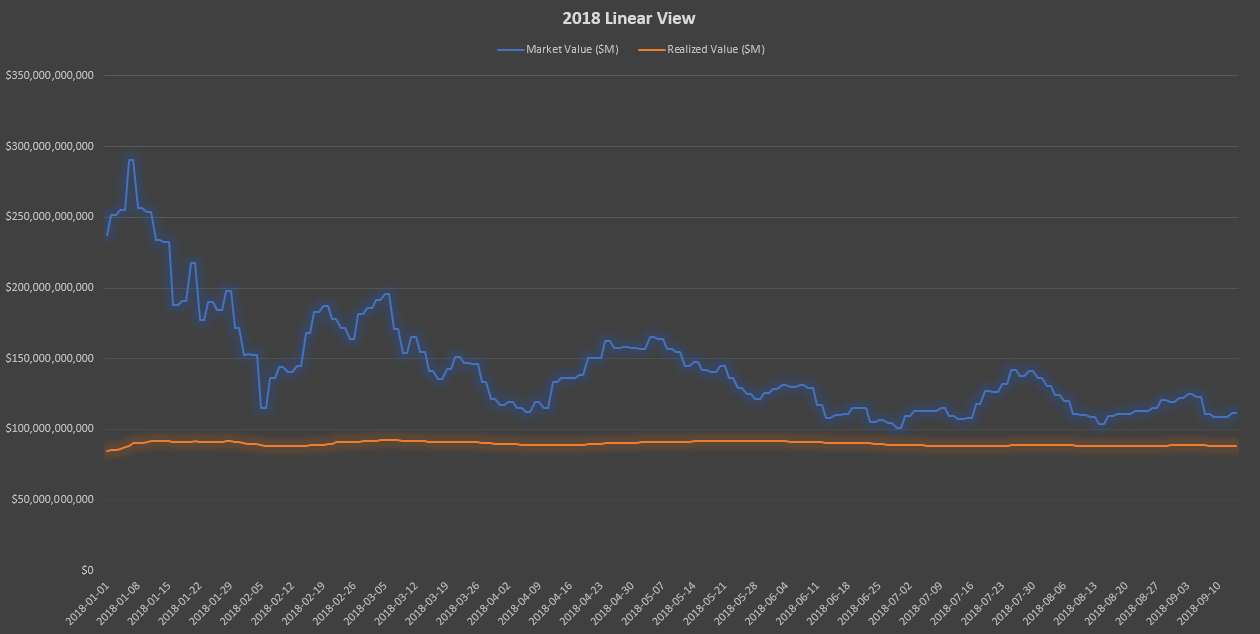
A zoomed-in linear version of the current environment gives us a clearer view of how market value remains overextended above realized value.
Some Caveats
As with any fundamental or technical indicator, we recommend using this particular tool with prudence. Some observations:
- Thresholds: Going forward, as market cap decreases in volatility, we believe that the upper threshold of MVRV might not prove as reliable — as market cap overextends less and less above realized cap as time progresses. However, we expect the lower threshold to remain useful to detect Bitcoin’s undervaluation in multi-month periods ripe for accumulation. This is to say that the saving power and the speculative power of Bitcoin will become, increasingly more and more, very closely intertwined.
- Precision: MVRV ratio only provides a long-term perspective of BTC market cycles — specifically, to apply Wyckoffian terminology, distribution and accumulation phases.
- _Technical methodology:_The use of MVRV as a momentum oscillator where the breakage of a trendline implies capitulation (similar to NVT signal or the Mayer Multiple) still comes into question. Thus, more conservatively, we provide two recommendations: (a) to analyze this indicator as a companion to other fundamental and technical tools; and (b) mostly use its thresholds for multi-yearly analysis; a diagnostics tool of Bitcoin’s “hodling” health.
- Realized cap: It is important as well to remember that realized cap may drop given a black-swan shock event where strong hands lose confidence in BTC. For this reason we recommend assessing market value and realized value both as a ratio and separately.
Acknowledgements
We would like to thank the following people, whose work and help was essential for this analysis:
- Nic Carter and Antoine Le Calvez, for inventing the realized cap and providing us with invaluable data.
- Pierre Rochard, whose initial idea was the starting point for the invention of realized cap.
- Willy Woo and Dmitry Kalichkin, whose work on NVT and NVM has been deeply influential.
- Saifedean Ammous and Jimmy Song, for providing crucial ideas in developing a theoretical framework for MVRV.
Sources and Data
- Daily market value and realized value data provided by Nic Carter (Castle Island Ventures) and Antoine Le Calvez (Blockchain.info).
- Ammous, Saifedean. The Bitcoin Standard. Hoboken: Wiley, 2018.
- Song, Jimmy. “The Antifragility of Bitcoin.” Off-Chain with Jimmy Song YouTubeChannel:https://www.youtube.com/watch?v=LYjUOFc0OMo