Are Bitcoin Bubbles Predictable?
Are Bitcoin Bubbles Predictable?
By Tobias Huber
Posted March 16th 2018
A Fundamental Valuation of Bitcoin and a Diagnostic for Bitcoin Bubbles
 Visualization of the bitcoin price _Spencer Wheatley, Didier Sornette, Tobias A. Huber, Max Reppen, Robert N. Gantner— based on our recently published paper.
Since its release in 2008 by Satoshi Nakamoto, Bitcoin has grown tremendously, and cryptocurrencies have become an emerging asset class. At the end of 2017, the price of bitcoin peaked at almost 20’000 USD, but now sits at around 8’500 USD. The explosive growth and volatility of bitcoin has intensified debates about the cryptocurrency’s intrinsic or fundamental value. While many have claimed that bitcoin is a scam and its value will eventually fall to zero, others believe that further enormous growth and adoption await, often comparing it to the market capitalization of stores of value, such as gold. By comparing bitcoin to gold — an analogy that is based on the digital scarcity that is built into the Bitcoin protocol — some market analysts predicted bitcoin prices as a high as 10 million USD per bitcoin. Given bitcoin’s wild trajectory, many are wondering where it will go next.
While there is an emerging academic literature on cryptocurrency valuations, which, for example, attributes some technical feature of the Bitcoin protocol, such as the “proof-of-work” system, as bitcoin’s source of value, an alternative valuation can be based on its network of users — the more users/nodes it has, the more valuable the network becomes. In the 1980s, Metcalfe proposed that the value of a network is proportional to the square of the number of nodes. Now, if Metcalfe’s law holds here, fundamental valuation of bitcoin may in fact be easier than valuation of equities — which relies on various multiples, such as price-to-earnings, price-to-book, or price-to-cash-flow ratios — and might, therefore, be indicative of bubbles.
Here, we develop a diagnostic for bubbles and crashes in bitcoin that combines Metcalfe’s law — which will provide a fundamental value for bitcoin — and the Log-Periodic Power Law Singularity (LPPLS) model, which has been developed to detect bubbles. When both measures coincide, this provides a convincing indication of a bubble and impending correction. For more details, see our paper.
A Fundamental Valuation of Bitcoin
Metcalfe’s law states that the value, in this case market capitalization (cap), of a network is proportional to the number of users squared — i.e., relating to the number of connections when all users are connected to each other. To visualize this, Figure 1 shows the bitcoin market cap versus the number of users in logarithmic scales, where a linear relationship with slope 2 would qualify Metcalfe’s Law. Fitting by linear regression provides an estimate of 1.7 — being significantly smaller than Metcalfe’s value of 2. This would mean that, for instance, for 1 million users, a typical user would be connected to “only’’ 10’000 other users, rather than 1 million.
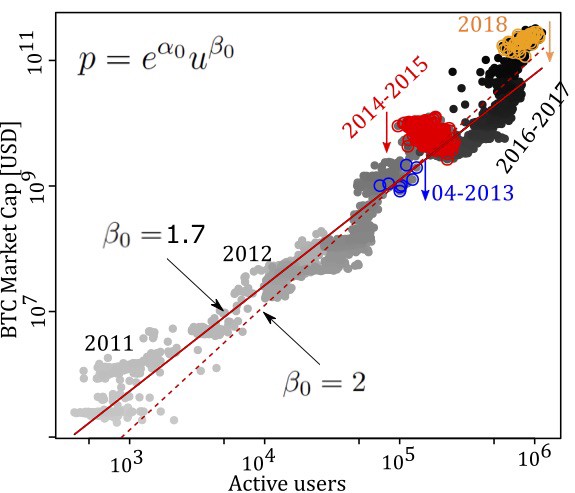 Figure 1: Scatterplot of the bitcoin market cap versus the number of active users, with logarithmic scales
It is however more interesting to directly compare the market cap predicted by Metcalfe’s Law with the true market cap, as visualized in Figure 2. In particular, we interpret the blue and orange dashed lines as fundamental support levels, whereas the rough red and green lines, with parameters given by the regression in Figure 1, fall between the fundamental level and bubble levels.
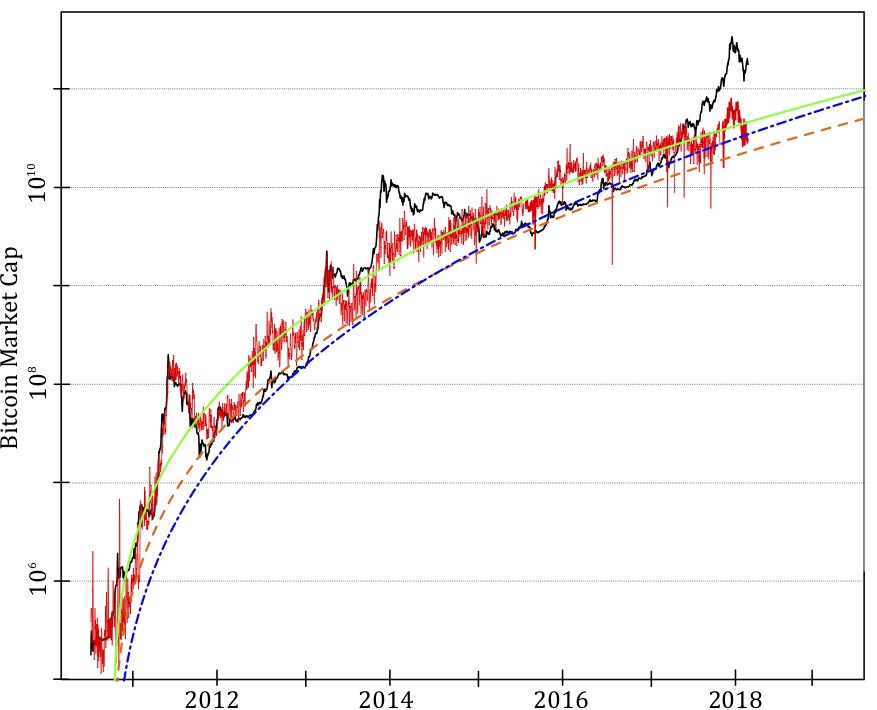 Figure 2: Comparing bitcoin market cap (black line) with predicted market cap based on various generalized Metcalfe regressions of active users.
In any case, the predicted values for the market cap indicate a current (as of the first week of March, 2018) over-valuation of at least four times. Further, assuming continued user growth (whose growth rate is in fact decreasing), the Metcalfe-based predictions for the market cap at the end of 2018 are 77, 39, and 64 billion USD respectively, still well below the current level. On this basis alone, the current market looks similar to that of early 2014, which was followed by a year of sideways and downward movement. In other words, some separate fundamental development would need to exist to justify such high valuation, which we are unaware of.
Bitcoin Bubbles: Universal Unsustainable Growth?
As is well known, bitcoin’s history has been punctuated by spectacular bubbles and crashes. We were able to identify four main bubbles, corresponding to massive upward deviations of the market cap from its estimated fundamental value. These four bubbles are highlighted in Figures 3 and 4 — in some cases exhibiting a 20 fold increase in less than 6 months! In all cases, the burst of the bubble is attributed to fundamental events: In 2011, for example, the bitcoin exchange Mt. Gox was hacked, which resulted in a 88% decrease in the cryptocurrency’s price. In 2013, China banned financial institutions from using bitcoin, which caused bitcoin’s market cap to drop by 50%, and two weeks later Mt. Gox shut down. Similarly, in the end of 2017, South Korean regulators threatened to close local cryptocurrency exchanges, which triggered a steep decline in prices. However, the fourth and most recent bubble was much longer, and it is plausible that the triggering factor, which resulted in the bubble’s bursting, was bitcoin’s all-time high price of 20’000 USD. In other words, bitcoin collapsed under its own weight.
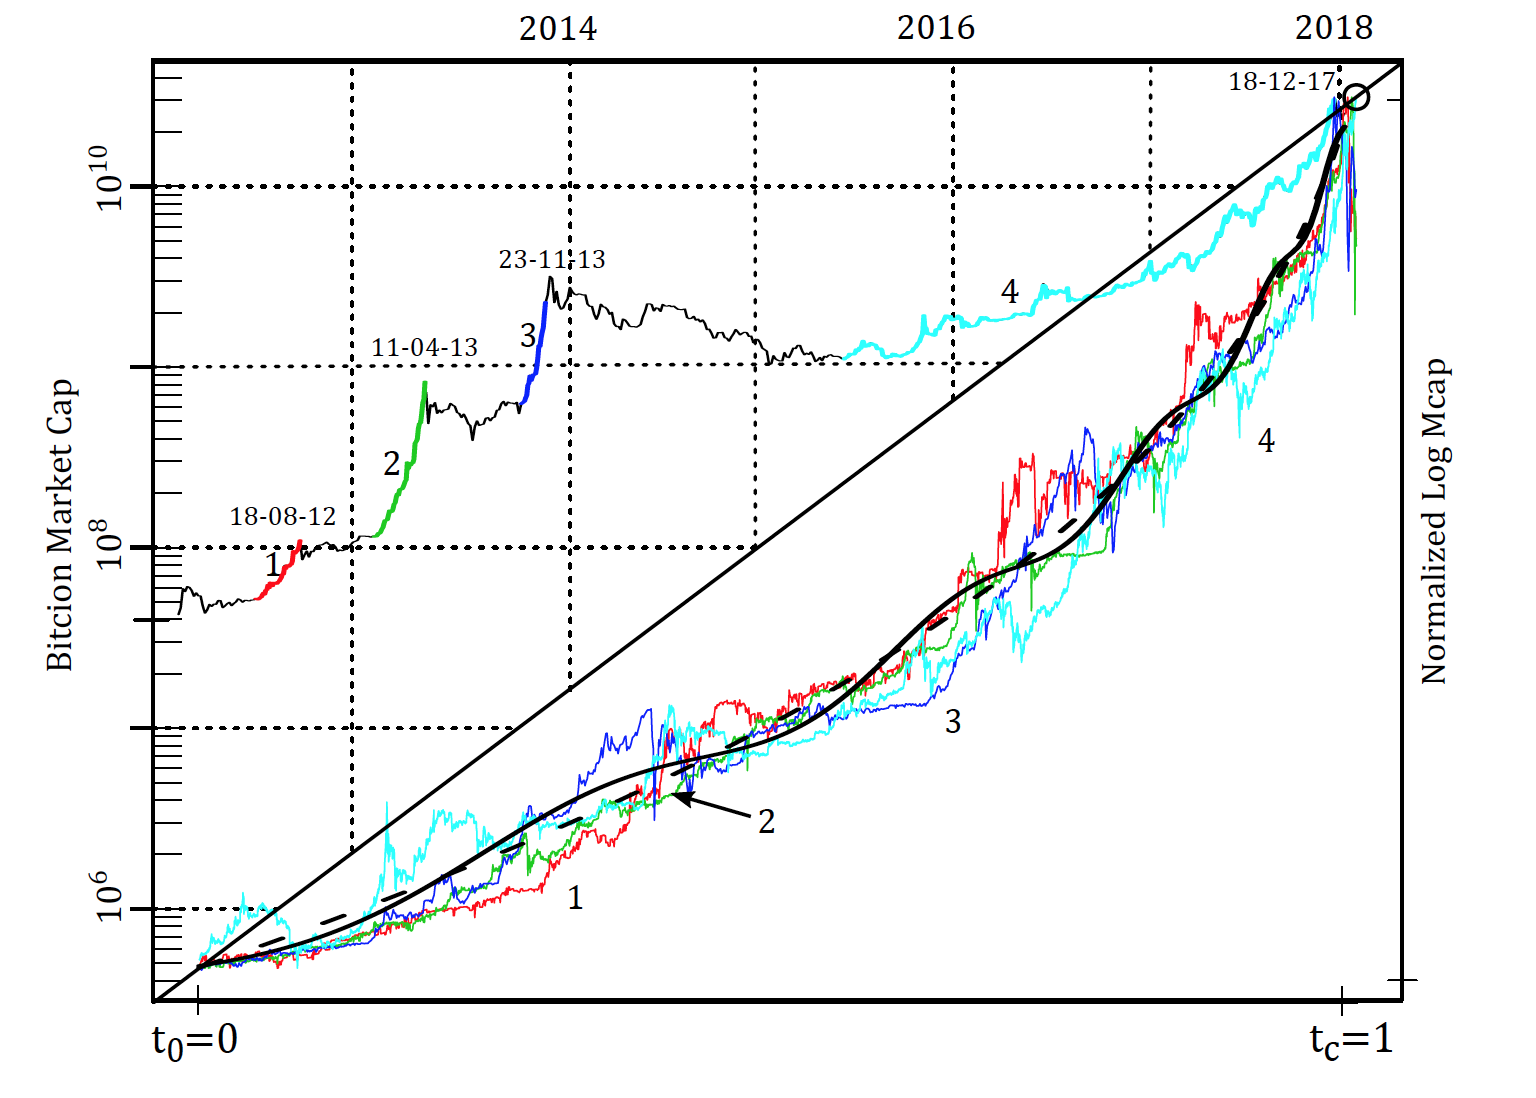 Figure 3: The upper triangle represents the market cap of bitcoin with four major bubbles indicated by bold colored lines, numbered, and with bursting dates given. The lower triangle shows the four bubbles scaled to have same log-height and length with the same color coding, and with pure hyperbolic power law and LPPLS models fitted to the average of the four bubbles, given in dashed and solid black, respectively.
What is interesting is that, although the height and length of these bubbles vary considerably, when scaled to the same log-height, a near-universal super-exponential growth is evident. And in this sense, like a sandpile, once the scaled bubble becomes steep enough (the so-called angle of repose), it will avalanche. In other words, what causes the collapse is the instability of the system itself; the instantaneous cause of collapse is secondary. This key insight is built into the Log-Periodic Power Law Singularity (LPPLS) model, which has been developed by Didier Sornette and collaborators.
In sharp contrast to the deeply entrenched view in finance and economics that financial bubbles can be characterized as unpredictable phenomena, as asset prices are assumed to follow random walks, the LPPLS model captures the radically different insight that financial markets have predictable components. Based on Sornette’s hypothesis that the underlying causes of crashes should be identified in the preceding period, the LPPLS model captures the unsustainable super-exponential price acceleration, which means that the growth rate of the price grows itself. As the speculative frenzy intensifies and the bubble matures, the market approaches a critical point, being driven by positive feedbacks in herding and imitation behavior, at which time any small disturbance can trigger a crash.
Formally, the model looks like this:

where p_i is the price of the asset, t_c corresponds to the bubble, and ε(t) is noise. When applied to bitcoin, the LPPLS allows one to detect the signatures of bubbles, which are represented in Figure 3.
Now, given the proposed fundamental value of bitcoin based on the generalized Metcalfe regression presented above, we define the Market-to-Metcalfe value (MMV) ratio as the actual market cap divided by the market cap predicted by the Metcalfe support. As shown in Figure 4, bubbles are persistent deviations of the MMV above support level 1. In our paper, we show that these bubbles are not only well modeled by the LPPLS model, but that the model offered useful advance warning information for the 2017 correction, producing a confidence interval bracketing the true crash time, when back-tested.
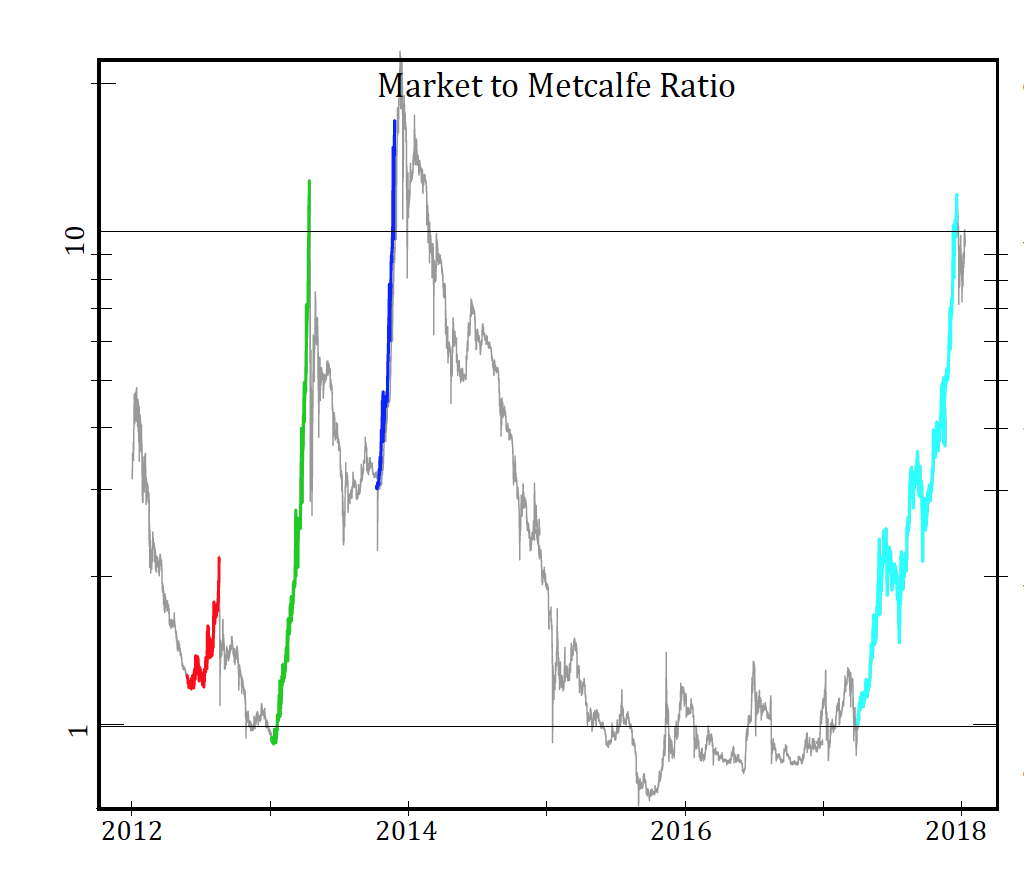 Figure 4: Market-to-Metcalfe value ratio (MMV) over time. The apparent bubbles, which radically depart from the fundamental level 1, are colored.
To sum up, by combining a generalized Metcalfe’s law, which provides a fundamental value based on network characteristics, with the Log-Periodic Power law Singularity (LPPLS) model, we were able to develop a rich diagnostic of bubbles and their crashes that have punctuated the cryptocurrency’s history. In doing so, we were able to diagnose four distinct bubbles, being periods of high overvaluation and LPPLS-like trajectories, which were followed by crashes or strong corrections. This is in radical contrast to the view that crypto-markets follow a random walk and are essentially unpredictable. Further, in addition to being able to identify bubbles in hindsight, given the consistent LPPLS bubble characteristics and demonstrated advance warning potential, the LPPLS can be used to provide ex-ante predictions. Our Metcalfe-based analysis indicates current support levels for the bitcoin market in the range of 22–44 billion USD, at least three times less than the current level. Given the high correlation of cryptocurrencies, the short-term movements of other cryptocurrencies are likely to be affected by corrections in bitcoin (and vice-versa), regardless of their own relative valuations.