
A Primer on Bitcoin Investor Sentiment and Changes in Saving Behavior
| If you find WORDS helpful, Bitcoin donations are unnecessary but appreciated. Our goal is to spread and preserve Bitcoin writings for future generations. Read more. | Make a Donation |
A Primer on Bitcoin Investor Sentiment and Changes in Saving Behavior
By Tuur Demeester , Tamás Blummer , and Michiel Lescrauwaet
Posted February 20, 2019
In our conversations with institutional investors, we often get asked the question “What is your model to value Bitcoin?”. Investors want to know what the fundamental drivers are behind BTC price gyrations, and whether at a given time Bitcoin is overvalued, undervalued, or at fair value. The new measures we suggest here are tools to help with that judgement. We build on work that goes back to 2011, and use the Bitcoin blockchain to extract market information not generally available for traditional commodities.
We suggest two new ways to measure changes in Bitcoin saving behavior:
- Relative Unrealized Profit/Loss Ratio(≈investor sentiment)
- HODLer Position Change(≈insider buying/selling)
Also introduced is the Liveliness measure, which reflects the extent to which a cryptocurrency is meaningfully used by savers.
A History of Bitcoin Valuation Research
Here’s an overview of the quantitative approaches we’ve seen Bitcoin investors take to help them decide what its fair value is at any given time.
- In 2010, Bitcoin users tried calculating the “value” of one Bitcoin by estimating the electricity cost of mining it. However, the usefulness of this was quickly dismissed, as the cost of mining goes up when investors bid up the price of Bitcoin.
- In 2011, early investors came up with the idea of calculating Bitcoin’s market cap as a valuation tool, and with the concept of ‘Bitcoin Days Destroyed’. The latter was dubbed an “indicator of market health and participation “ and it was the first valuation metric that considered the age of addresses. There was also discussion about a “Price over Difficulty” ratio, to determine whether it was better to mine than to buy BTC, and forum threads emerged about how many lost coins there might be.
- In 2012, Trace Mayer suggested the 200 Daily Moving Average of Bitcoin’s market capitalization as a value indicator, because it filters out the long-term secular uptrend .
- In 2013,various authors explored the idea that Bitcoin’s price is in a long-term parabolic uptrend, and that deviation from that trend line is indicative of over- and under valuation.
- On January 1st, 2014, user gbianchi proposed “Network Value” as the ratio of Bitcoin’s address growth and its market capitalization — similar analyses followed later that year.
- In November 2014, developer Jon Ratcliff published his analysis of the blockchain, showing the distribution of bitcoins based on age of last use, and commented “This graph shows … how many bitcoins are actively moving at any one time over time.”
- In September 2017,Willy Woo and Chris Burniske published research around the NVT ratio, which was called a “PE Ratio for Bitcoin” as it focused on comparing Bitcoin’s on-chain volume with its market cap.
- In March 2018, Dmitry Kalichkin suggested a variation on NVT which he dubbed the 90-day NVT ratio. Two months later he introduced the Network Value to Metcalfe ratio (NVM) which was based on Daily Active Addresses.
- In April 2018, Dhruv Bansal updated Ratcliff’s work on UTXO age distribution, and suggested the concept of HODL waves. He commented: “It is not possible to make charts such as the one above for traditional asset classes. It’s only Bitcoin and other public blockchains that meticulously track these data throughout their whole histories. This enables post-hoc analyses of large-scale market behavior.”
- In October 2018, inspired by Pierre Rochard, Nic Carter and Antoine Le Calvez created the Bitcoin “realized cap” which is the aggregate value of the UTXOs priced by their value when they last moved. Soon after, Bitcoin “thermocap” or “accumulated security spend” was suggested, which is the aggregated miner revenues over the entire history of Bitcoin.
- That same month, Murad Mahmudov and David Puell published work on the Bitcoin Market-Value-to-Realized-Value (MVRV).
- In December 2018, Tamás Blummer introduced the concept of Liveliness, which reflects how much a given blockchain is used for meaningful transaction settlement.
Goal: Measure Changes in Saving Behavior
Given that we view Bitcoin’s primary use case as censorship resistant store of value (digital gold), and its utility as a payment mechanism as only secondary, our main goal in identifying the components of our valuation toolbox is to find data that specifically reflects changes in saving behavior.
Limitations and challenges of existing valuation methodologies
The Bitcoin blockchain records a lot of data, but not all data. It is blind to how many bitcoins are lost. It doesn’t know whether a transaction represents a transition from one owner to another (sale), or whether it’s simply the same owner moving coins to another address in his control. It also doesn’t reflect off-chain transactions — for example it won’t show balance transfers from one Bitfinex user to another, or Liquid Sidechain transactions, or Lightning Network transactions.
The limitations of blockchain-recorded information, as well as the commodity nature of cryptocurrencies themselves, have consequences for valuation methodologies:
- With cryptocurrencies, information about real circulating supply is opaque, exchange listing requirements are often extremely loose, and dilution schemes can be stretched to extremes. Assigning a “market cap” to a cryptocurrency (mined coins × token price) doesn’t at all create an objective comparison tool — a coin’s “market cap” doesn’t teach us anything about the commitment of coin holders. To illustrate: a centralized coin with a premined supply of 1 billion tokens and a single recorded sale of one token for $10 would yield a $10 billion market cap, identical to a decentralized coin with a large community of long-term savers. This “market cap” measure is also blind to lost coins, which stretches the comparison with the securities world where the assets are held by transfer agents, making loss a very rare phenomenon.
- The challenge with using the number of active addresses or transaction volumes (e.g. NVT, NVM) is that these data sources don’t allow us to separate behavior that is long-term oriented from behavior that is short term oriented. These measures don’t directly differentiate speculators from value investors, and can conceivably be gamed or inflated by moving a large amount of coins back and forth, or by creating a flurry of small on-chain transactions.
Solution
Our solution is to collect data that places each circulating quantity of Bitcoin in its historical context, in the tradition of previous work such as HODL Waves, Realized Cap, and MVRV. We focus on the data provided by the Bitcoin blockchain, as this is the ultimate (most secure and final) settlement layer for all its important transactions. By taking the Output Quantities of a block, and combining it with the Recorded Time of that block, we learn more about the behavior of Bitcoin savers.
Relative Unrealized P&L (≈investor sentiment)
Every time a bitcoin moves on the blockchain, its market value is realized. The owner was aware of its value and affirmed his control over it at the point of the move. It doesn’t matter if the transaction represents the owner sending the coins to somebody else (a sale or gift), or if it is an act of self-dealing.
If we value every coin at the time it last moved and aggregate these values, we arrive at the “Realized Capitalization .”
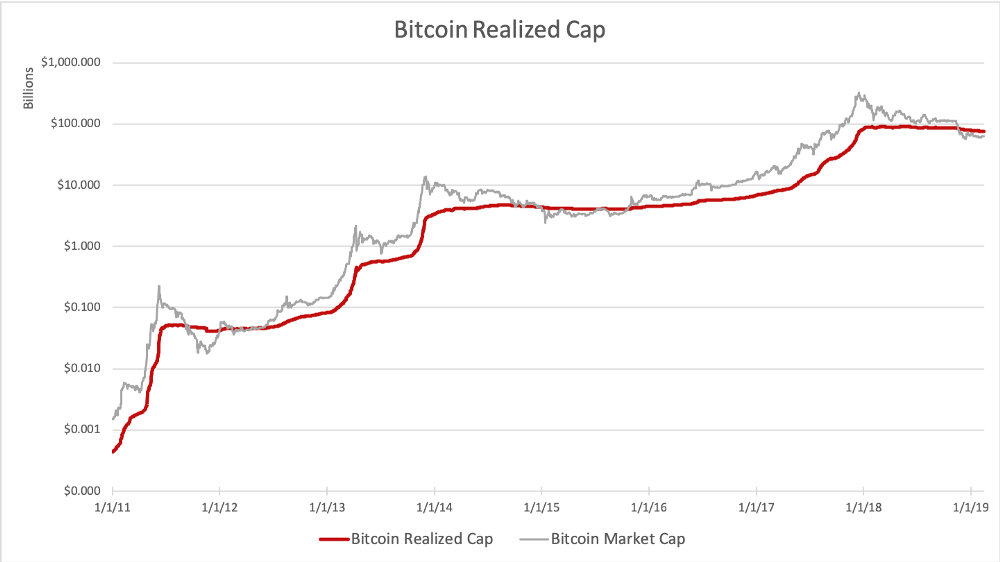
By subtracting the Realized Cap from the Market Cap, we calculate Unrealized Profit/Loss (P&L):
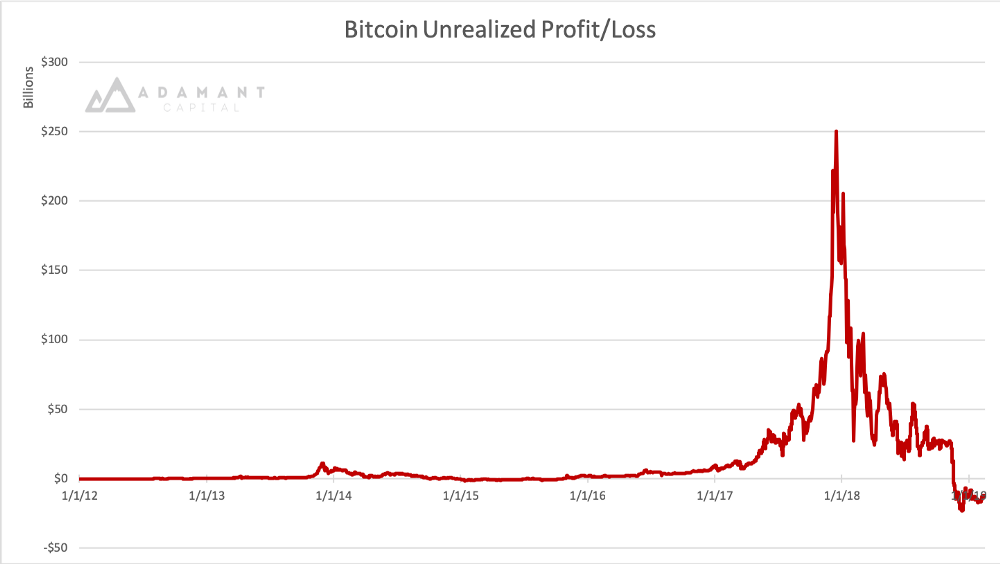
We see that Bitcoin investors in aggregate currently face a significant unrealized loss, which is quite a change if compared with the 2017 huge unrealized profits.
The measure of Unrealized Profit also contains the unrealizable profit of Lost Coins. Some coins are certainly lost as they were associated with a provably un-spendable output script, but the majority of lost coins can only be guessed by setting a threshold of inactivity after we consider them Lost.
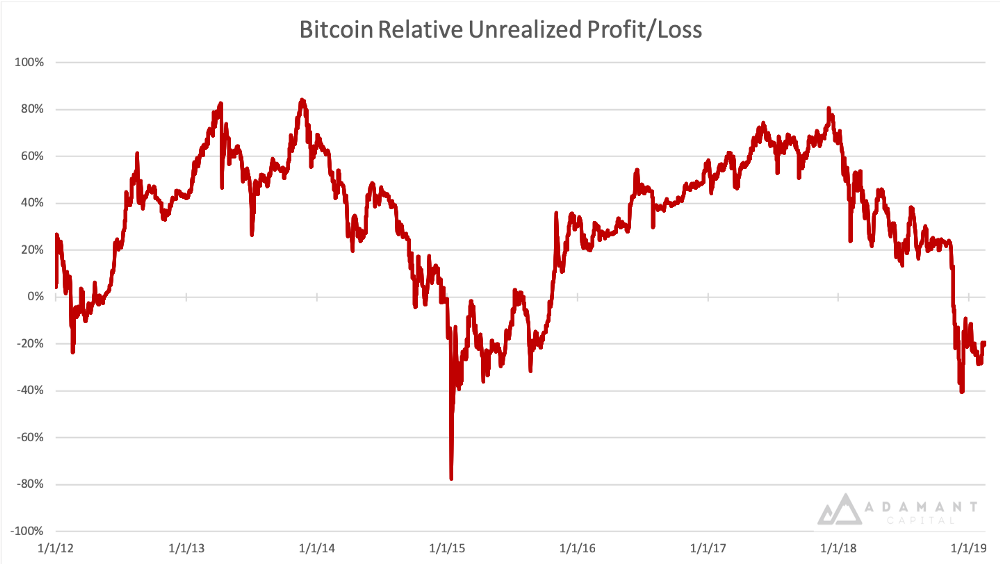
The measure of Unrealized P&L estimates the total dollar amount of paper profits/losses in Bitcoin, but it does not clearly filter out the relative change that accompanies it. By dividing Unrealized P&L by the Market Cap, we arrive at the Relative Unrealized P&L, which can be interpreted as an indicator of investor sentiment:
When a high percentage of Bitcoin’s market cap consists of unrealized profits, it can be interpreted that investors are greedy. The ratio drops as prices decline and investors likely become more fearful. When the unrealized gains turn into unrealized losses, we enter the phase of capitulation and apathy. Here’s a suggested illustration:
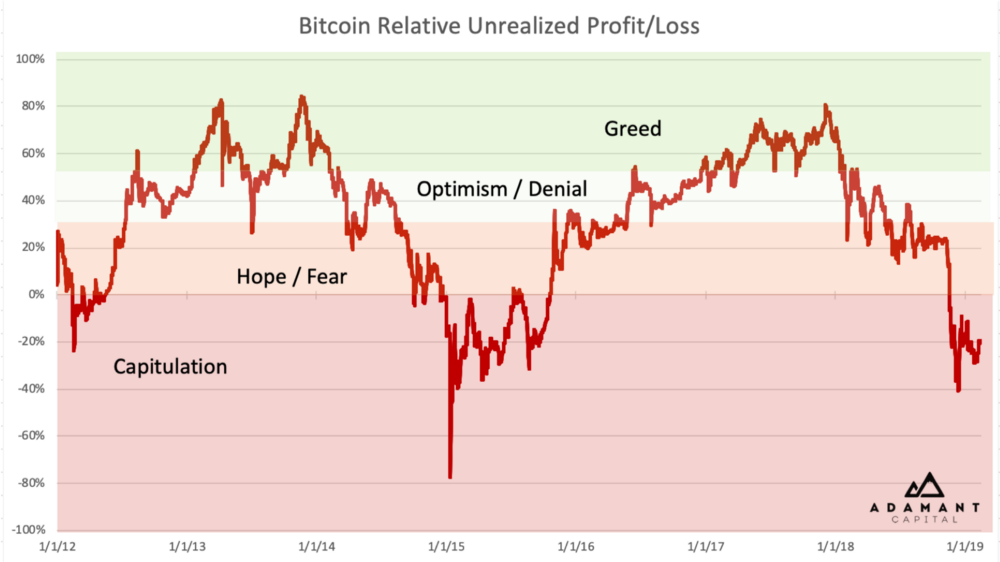
So why does the percentage of Relative Unrealized P&L go up in a bull market? What this indicates is that on average, investors are realizing profits at a slower rate than the growth in the market cap. For the time being, 20% of the market cap consists of ‘underwater’ holdings — coins that would generate losses if they were sold today.
Before we move on to a new suggested valuation tool, HODLer Net Position Change, we first need to explain the measure of Bitcoin Liveliness.
Liveliness
The idea of old coins moving on the blockchain has always spoken to the imagination of Bitcoin enthusiasts and investors: “What are the ‘Bitcoin whales’ doing?”, “What might Satoshi be up to?”, etc. The analytical work mentioned in our historic overview provides investors with information on how Bitcoin savers move coins at any given time. However, the challenge with measures such as HODL waves is that they don’t provide us with a clear signal or unambiguous utility. We instead propose a single measure that focuses on the coins that move relative to how long they were previously dormant.
What is Liveliness?
Liveliness is a new quantitative measure that gives insights to shifts in saving behavior. The higher the amount of meaningful transaction settlement a blockchain accommodates, the higher its Liveliness.
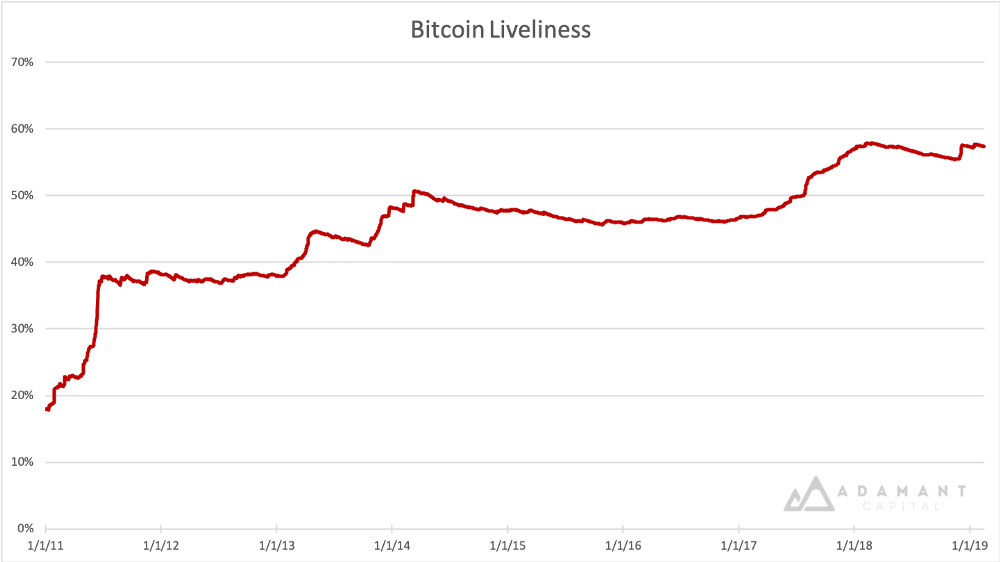
Liveliness can be defined as the ratio of the sum of Bitcoin Days Destroyed and the sum of all Bitcoin Days Ever Created. (See here for a more detailed breakdown.)
Let’s illustrate with a few examples:
- A blockchain that during its lifetime has not yet seen a transaction other than issuance, has a Liveliness of 0%. Likewise, a blockchain where only one recent balance is systematically moved back and forth would produce a very low Liveliness — in other words, this measure is unforgiving for lack of meaningful transactions. Bitcoin has high Liveliness if it facilitates the transfer of large amounts of old coins on a regular basis.
- A blockchain where all the coins move within a single block has at that moment a Liveliness of 100%. A blockchain of two years old with no new block rewards, and where exactly one year ago all coins moved within a single block and no transactions moved since, would have a liveliness of 50%. In other words, the measure fluctuates relative to the total lifespan of the blockchain.
- The total circulating supply also impacts Liveliness: if in the previous example 20% more new coins were created in the year since all the coins were moved, then the Liveliness today would not be 50% but only 40%. So this measure also warns us about blockchains with high inflation/dilution.
Liveliness can be used to weight market cap if comparing cryptocurrencies, as it will be close to zero for currencies that have inflated market cap through pre-mined coins or wash trading of the same few units.
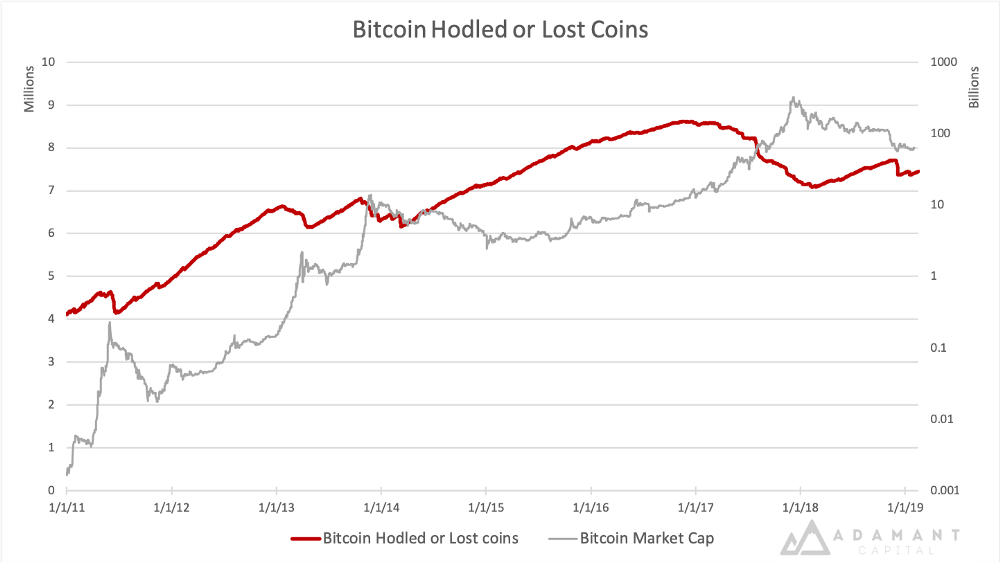
Besides this, Liveliness can also be used as a foundational tool from which to derive other insightful time series. One of these metrics is the aggregation of Lost or HODLed Bitcoins and alerts us to moves of large and old stashes. For this purpose, subtract Liveliness from 1 and multiply with the circulating supply at the time.
HODLer Position Change (≈insider buying/selling)
Now that we know the approximate number of coins that are held as a long term investment or are lost, we can approximate the monthly position change among Bitcoin savers. We call this measure HODLer Net Position Change. Because it only measures actual moves of coins, our graph naturally excludes lost coins.
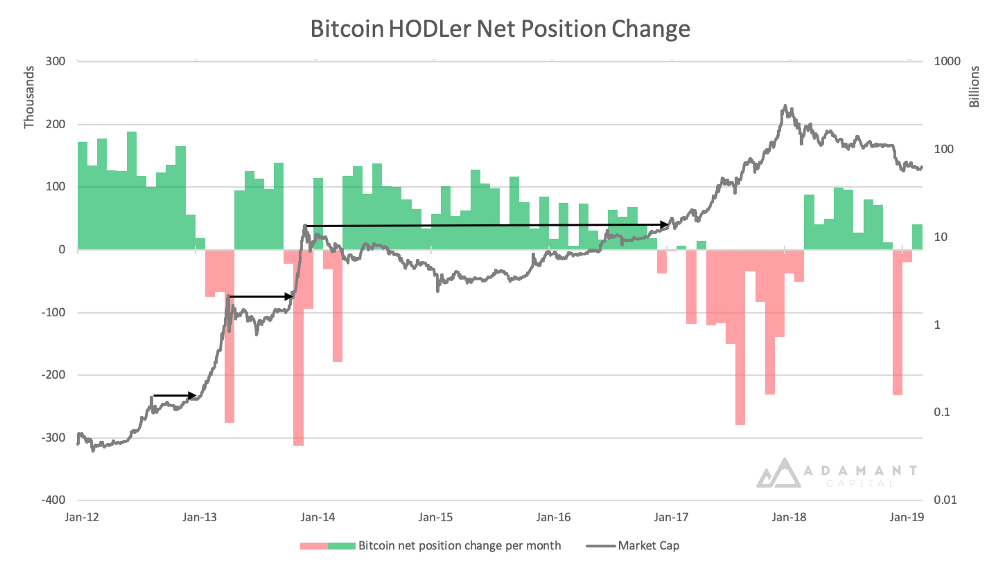
We see that significant quantities were cashed out during bull markets of Bitcoin, and net new positions were accumulated by HODLers in bear phases. Net buying seems to switch into net selling once the previous top is reached (cf. arrows on the graph above).
It’s important to note that a significant amount of coins are held on Bitcoin exchanges and that mere administrative decisions on their behalf can have a significant impact on measures like HODLer Net Position Change. However, serious effort has been made to de-anonymize exchange addresses, so future analysis should be able to mitigate for “exchange bias.”
For example, one anomaly in the graph is the recent negative position change of meaningful Bitcoin savings (Dec 2018). While at first sight this is worrisome, we found evidence suggesting that a significant part of the move stems from Coinbase reshuffling around 5% of all BTC in circulation.
Another notable negative position change is the 278,000 BTC net move in August 2017. This is likely attributable to the Bitcoin Cash hard fork (BCH) of that same month. Every Bitcoin private key gave access to an equivalent amount of BCH as the BTC in that wallet. And so with BCH rallying strongly — at some point reaching over 20% of a BTC — Bitcoin HODLers were incentivized to split the two via on-chain transactions and either buy more BCH and sell their BTC, or vice versa. Given how strong the (flawed) narrative was at the time of BCH being “the real Bitcoin,” it’s conceivable that many old bitcoins were actually sold. More analysis is needed in this area.
Conclusion
By creating tools that measure changes in saving behavior on the Bitcoin settlement layer, we believe to have meaningfully contributed to the valuation debate. Relative Unrealized Profit/Loss in Bitcoin tells us about Mr. Market’s emotional state, HODLer Net Position Change gives us information about how Bitcoin whales are moving their pieces on the chessboard, and Liveliness gives us a powerful tool to meaningfully compare long-term investor activity, as well as a platform for building new valuation measures in this space.
In a follow-up article we will share our take on what these and other measures tell us about Bitcoin’s valuation today. Feel free to contact us with questions, or sign up here for future research updates.